1-2-3 Trading Setup: The Complete Stoic Edge Guide
Learn the moving-average 1-2-3 setup, boundary-break and PTB entries, stops, trade management, and when to wait, with illustrated examples.
12 min read
The Stoic Edge 1-2-3 trading setup reads a change in direction in three stages: price breaks the active moving-average area, builds a base or retest, then expands out of that structure. The sequence gives you a way to describe the chart before deciding whether a trade is worth its risk.
This guide covers the full framework and its two entry approaches. Module 01 permits a discretionary entry as price breaks the selected Step 2 boundary. Module 02 teaches a more focused pullback entry using a completed candidate candle, the Pullback Trigger Bar, or PTB.
Those entries happen at different moments. Naming which one you are taking keeps the trade review honest.

All diagrams in this guide use invented prices to explain decisions. They are not actual trades, backtests, or evidence of expected returns.
What the 1-2-3 pattern means here
“1-2-3 pattern” can describe several trading methods. In Stoic Edge, the numbers refer to the moving-average sequence below. They do not mean a generic three-swing reversal or three consecutive candles.
- Step 1: break. Price breaks through the active 10 and 20 simple moving average area in the proposed direction.
- Step 2: base or retest. Price pauses, overlaps, or retests around that area and leaves a readable boundary.
- Step 3: expansion. Price breaks out of that structure. An intrabar break is developing and unconfirmed; a meaningful close confirms the expansion.
For a bullish sequence, look for the break upward, the base, and expansion above it. Reverse the direction for a bearish sequence. Neither version guarantees continuation.
The useful question is whether you can mark each stage using only the candles available at the decision. If the labels become obvious only after a large move, go back to replay and freeze the chart earlier.
Start with direction, location, and room
For the primary intraday workflow, begin on the daily and hourly charts. Mark relevant prior-day highs, lows, and close; the prior-week close; session ranges; and nearby support or resistance. Keep the map selective enough to use.
Then ask three concrete questions. Which direction does the broader chart support? Where is the proposed entry relative to important structure? How much room remains before price reaches the next decision area?
The five-minute chart is the teaching default for the intraday pattern, entry, and initial management. Choose chart roles before the setup activates. Switching to another interval after missing an entry makes it difficult to know whether you followed the original plan.
The moving averages have distinct jobs:
- 10 SMA: fast momentum and the immediate pullback area.
- 20 SMA: the main momentum, pullback, and extension reference.
- 50 SMA: an intermediate gate and a possible wider management reference when the trade intention calls for it.
- 200 SMA: broad regime and directional context.
These are simple moving averages in the System framework. Compass also displays a 200 EMA, an exponential moving average used by the indicator. That display does not replace the System's 200 SMA rule. See the moving-average reference for the distinction.
Step 1: recognize the break without rushing the entry
Step 1 alerts you that price has crossed the active 10/20 area. It starts a possible sequence; it does not prove a new trend or create a PTB entry.
The large bullish candle through the averages may look convincing, but price can fall straight back. Watch what happens next. Does the chart form a readable pause, or does it keep crossing the averages without a coherent range?
For a bearish example, price breaks below the area. You still need to evaluate the next structure and the larger map. Selling solely because one candle crossed an average skips the rest of the process.
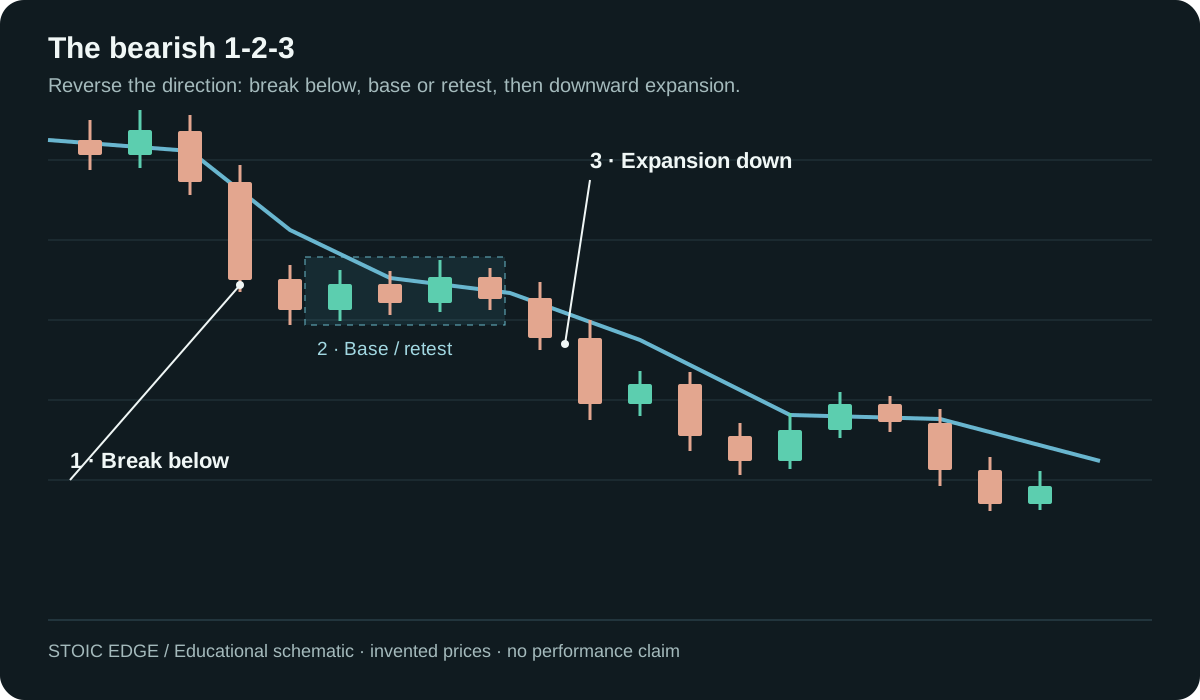
The bearish illustration reverses the directional sequence using invented prices.
Step 2: mark one coherent base
Step 2 needs consolidation or a retest. Several candles climbing in the same direction are not a base just because you can count them.
Mark the boundary of the structure you are actually using before the breakout. Overlapping candles can briefly cross the averages and still belong to one coherent base. Splitting that base into a new sequence at every crossing adds labels without improving the decision.
There is a difference between overlap inside a readable range and repeated, directionless crosses with no defensible boundary. The latter is a reason to wait. If two traders cannot tell which boundary your plan uses, annotate it before advancing replay.
Step 3: separate the break from confirmation
Price breaking the selected Step 2 boundary creates a developing Step 3. Module 01 allows a discretionary entry during that intrabar break. At that moment the expansion is unconfirmed. The meaningful close beyond the structure confirms it.
That distinction matters if price pokes through the boundary and returns inside. An earlier entry accepted the risk that confirmation would never arrive. Do not relabel it as a confirmed entry afterward.
Module 01 does not supply one universal numerical definition of a meaningful close, order buffer, or fill rule for every instrument. Your execution plan must specify what you will do with those uncertainties. If you cannot define the action and risk before the break, wait.
Two entry approaches within the same framework
Boundary-break entry: use the selected Step 2 boundary during a developing Step 3, accepting that the bar has not yet confirmed the expansion. State the invalidation, size, and order handling before activation. The PTB's opposite-side stop convention should not be copied onto a trade that has no PTB.
PTB entry: after a clear sequence, wait for a clean pullback toward the 10/20 area and a completed eligible candle. Its directional trade-through confirms the final candidate as the PTB and may trigger the trade under your risk plan.
The rest of the entry examples focus on the PTB because it gives the learner a specific candle to identify, compare, and review. This does not remove the earlier entry from the broader framework.
How a completed candidate becomes the PTB
During a clean bullish pullback, track the latest eligible completed candle near the active 10/20 area. Ignore an inside bar as the active candidate. If a newer eligible non-inside candle completes before entry, it replaces the earlier candidate.
The final candidate becomes the bullish PTB when price trades through its high. For a short, price trades through the candidate's low. The candidate must close first; the later trade-through does not require another candle close.
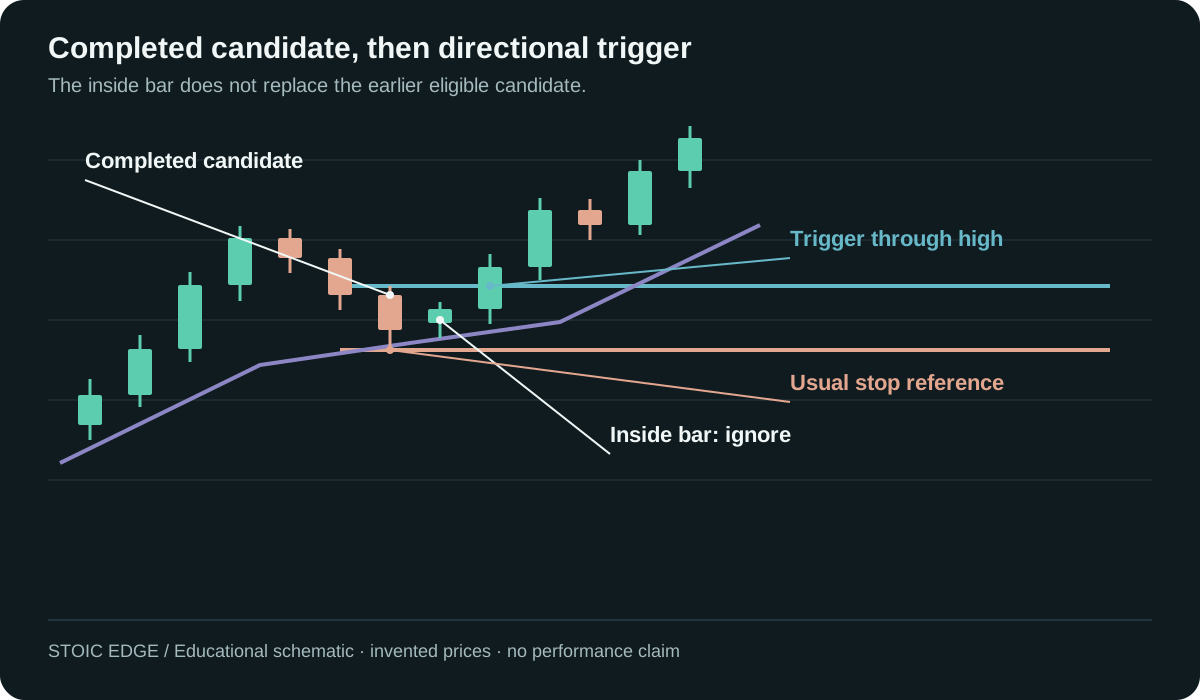
Suppose an invented bullish candidate has a high of 104 and a low of 101. The next candle stays entirely inside that range. The inside candle does not replace the candidate. The later print above 104 is the directional trigger. These prices explain the sequence only; they prescribe no particular order type or buffer.
If a new eligible non-inside pullback candle completes before the trigger, mark its high and low instead. If the pullback destroys the active direction, stop tracking it as a valid long candidate.
There is no three-candle limit or fourth-candle expiry in the current teaching. Continued eligibility depends on the structure, candidate replacement, room, and risk. The numerical countdown cannot make a broken setup valid.
Place the stop reference before calculating size
For the PTB approach, the other side of the bar is the usual stop reference. Visible moving-average or sweep structure can require extra room in a particular case. That is a structural judgment to record before entry, not permission to widen risk after the trade moves against you.
First locate invalidation. Then calculate whether your allowed risk can accommodate the instrument and size. If even the smallest suitable unit creates too much risk, skip the trade. Leverage or a smaller advertised margin requirement does not reduce the loss caused by a given price move.
For a simplified position-sizing exercise, divide the allowed dollar risk by the estimated dollar loss per unit from entry to stop, allowing for costs. Round down to a tradable quantity. Real fills, gaps, and slippage can produce a larger loss than that estimate. The risk and execution reference lists the decisions this chart framework leaves to your account plan.
Use the prior extreme as the first management decision
For a long, mark the prior high made by the active move before the pullback. For a short, mark the prior low. In a clean teaching example, that extreme is easy to identify. When several swings compete, do not quietly choose whichever makes the outcome look best.
Check the room before entering. The trigger immediately underneath the prior high may leave little space compared with the stop distance. The valid-looking candle can still produce an unattractive trade.
At the first test, watch how price responds. Rejection can call for protecting the position at breakeven or exiting according to the plan. The clean break may justify trailing the remaining position behind current structure.
The demonstrated trailing references include a large five-minute candle, a new PTB, the 10/20 area, or the 50 SMA when a larger move was the declared intention. There is no universal trailing precedence or fixed partial quantity in this guide. Choose the management intention before the trade develops.
Module 01's confirmed opposite Step 3 is the final technical exit condition for any remaining position. Earlier protective stops and account risk limits still apply. Waiting for an opposite confirmation is not permission to exceed the original risk.
Worked example: a qualified long that continues
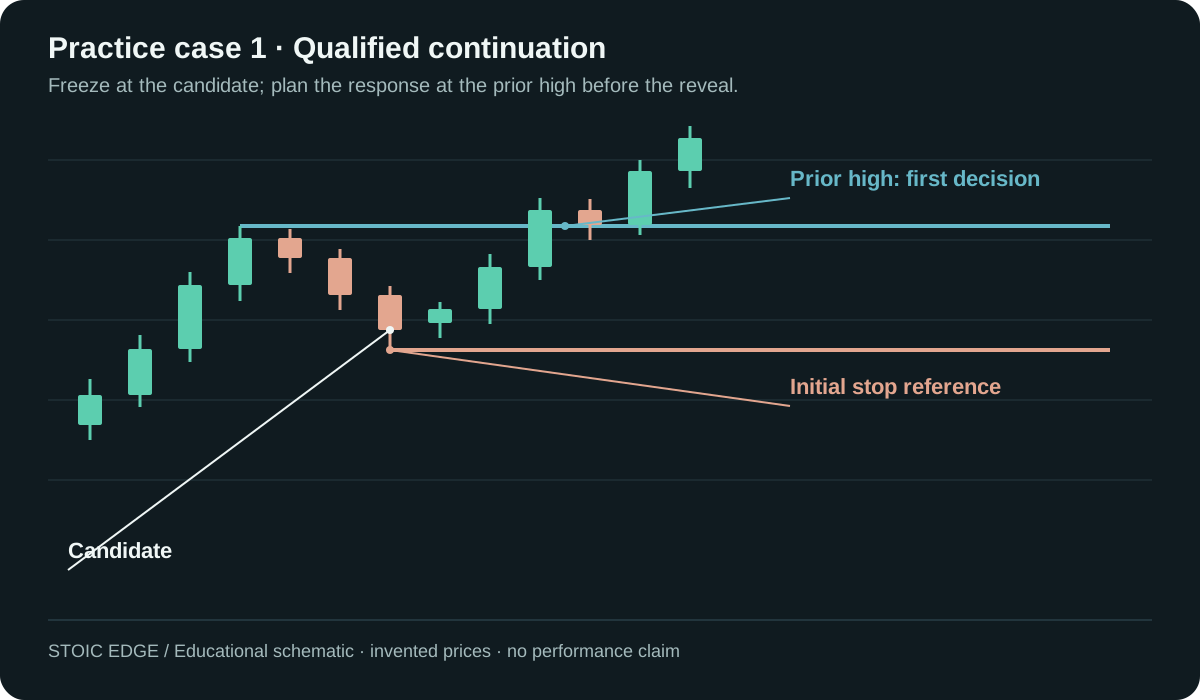
Freeze the chart at the completed pullback candidate. Assume the daily and hourly map supports the idea, the five-minute sequence is clear, the candle is eligible, and the distance to the prior high fits the written risk plan.
The trade-through triggers the hypothetical long. Price then reaches the prior high. Before revealing more candles, choose the response to rejection and the trailing reference for a clean break. In this illustration the move continues, but that outcome was unavailable at entry.
The useful review is whether the entry and management followed the plan. The picture cannot establish a win rate, expected R multiple, or live trading result.
Worked example: a qualified setup that fails
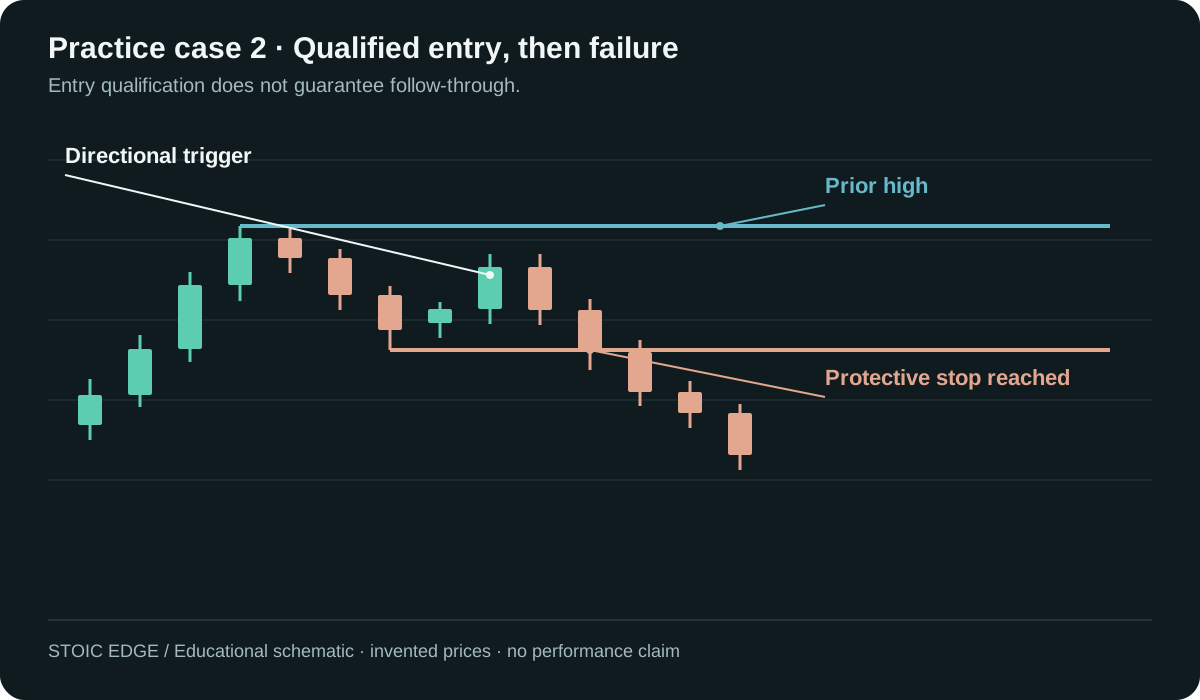
Begin with the same qualified conditions. The directional trigger occurs, but price reverses before a useful continuation develops. The planned protective stop ends the hypothetical trade.
The loss does not by itself prove that the original candidate was invalid. Review the frozen entry separately from the result. If the initial PTB failed while the same five-minute 10/20 structure remains valid, one later clean retry may qualify. It requires a new eligible candidate and enough room; it is not an automatic re-entry.
Two consecutive failed initial PTBs end that same-chart sequence. Return to wait for a new 1-2-3. This rule is not a general permission for unlimited retries on parent-led trades.
Worked example: wait despite an attractive candle
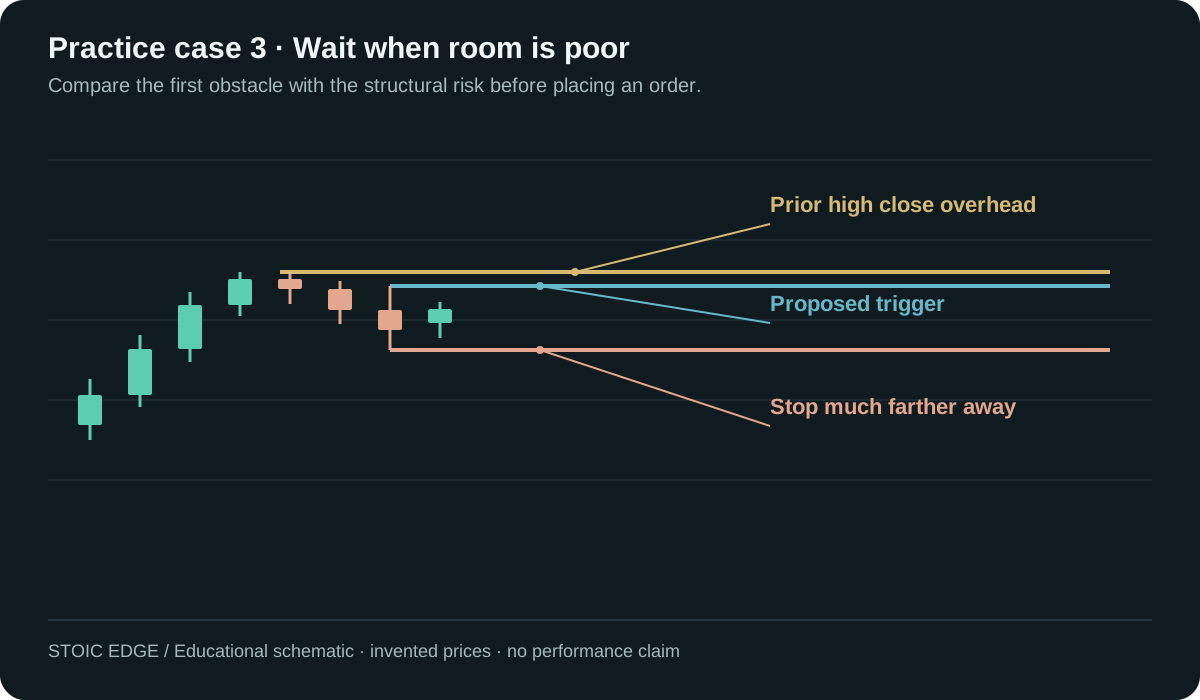
The candle looks clean, but its trigger sits close to the prior high. The stop reference is much farther away. Advancing the chart might reveal a winner, yet the decision still needs to use the room visible beforehand.
Record wait when the trade fails your room or risk requirement. Other reasons to wait include an unfinished candidate, an inside bar incorrectly treated as a replacement, destructive pullback, conflicting higher-timeframe context, excessive extension, poor liquidity, or a reached daily limit.
Continuation and parent-led trades
Later clean PTBs can appear while the active 10/20 move holds. They do not require a fresh full 1-2-3 every time. They do require a completed eligible candidate, a directional trigger, useful room, and available risk.
In parent-led work, one selected higher chart owns the larger pattern and activation level. The preselected lower chart can refine execution. The five-minute chart is the recommended execution default. The lower-chart candle does not repair an invalid parent idea, and a valid parent idea does not qualify a bad lower-chart candidate.
The exact timing between parent and execution triggers, parent-led retry policy, and gap handling are not fully mechanical rules in the source. Start with the chart-role reference and keep uncertain cases out of beginner practice.
Practice the decision before watching the outcome
Use chart replay with future candles hidden. Save a screenshot at the candidate and write down the map, sequence, chosen entry approach, stop reference, prior extreme, and reason to take or skip the trade.
Advance one candle at a time. Record what changed and which planned action it called for. Include losses, missed entries, ignored inside bars, and no-trade cases in your sample. The collection of attractive completed charts cannot tell you how consistently you identify the setup in real time.
Start with the three-case practice set, then use the entry and review checklists. If the labels keep changing after the reveal, simplify the exercise to one distinction, such as eligible candidate versus inside bar.
Where Compass fits
Stoic Edge Compass brings directional dots, caution warnings, Trend Ribbon, a 200 EMA, and support/resistance context onto a TradingView chart. Read new markers after the bar closes and use real market prices for risk, including when viewing Heikin Ashi candles.
Compass does not select your entry, stop, size, or exit. Green, red, and yellow readings do not replace the 1-2-3, PTB eligibility, or room check. Read the color guide and signal limitations before using it alongside the framework.
Common questions
Is a PTB the same thing as Step 3?
No. Step 3 is expansion from Step 2. The focused PTB entry comes from a completed eligible pullback candidate and a later directional trade-through.
Does every trade have to wait for a PTB?
No. Module 01 also permits the discretionary developing Step 3 boundary-break entry. Record which entry you chose and whether expansion was confirmed at that time.
Is the setup profitable on every market or timeframe?
This guide establishes no verified expectancy or universal performance claim. Market, session, costs, execution, and consistent classification need testing. The recognizable pattern alone cannot answer profitability.
Can I use the same dollar risk as a course example?
Course examples do not determine a suitable account risk amount for you. Define your own limits and account for the instrument's contract or share size, costs, and possible slippage before using real money.
Where should I study next?
The Stoic Edge System overview explains the learning path. The full reference holds the detailed rules. Public education does not require buying Compass or joining the community.
Reviewed September 11, 2026 against the current Stoic Edge System rulebook and Module 01/02 teaching. Educational material only; no personalized investment advice or guarantee of results.
Put the Lesson Into Practice
Study the course, keep notes and review trades in Stoic Journal beta, and learn alongside the Stoic Traders community.
Compare monthly and yearly course access before joining on Skool. Compass is included while monthly membership is active; yearly Premium includes lifetime course and Compass access. You can also get Stoic Edge Compass separately.
