Stoic Range Model: Consolidation, Expansion, and Two Setups
The Stoic Edge System is one map and two setups: mark the range, then study a sweep or a breakout. This is the start-here guide.
16 min read
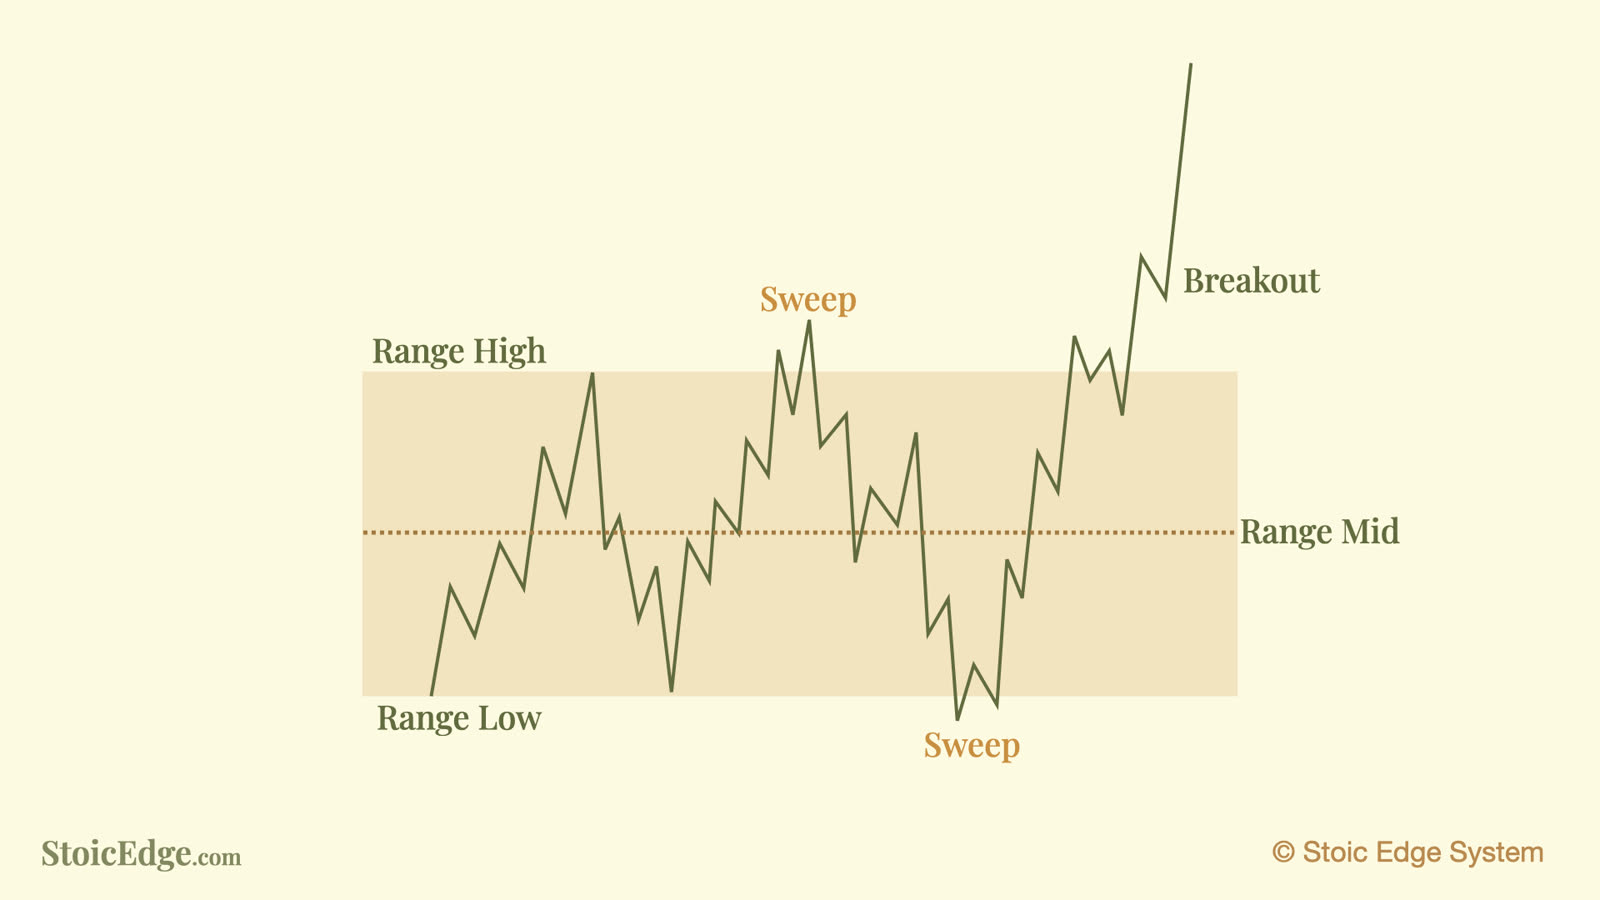
The Stoic Range Model is the Stoic Edge System. Price consolidates, expands, then consolidates again. The pause gives you a box. Once that box is marked, there are only two setups: a sweep-and-retest of a boundary, and a break-and-retest that holds.
That is the foundation. Other Stoic Edge lessons — PTB entries, swing failure, Fibonacci geometry, moving averages, SBS, the moving-average 1-2-3 — describe how you might enter or manage after the environment is marked. They are not competing systems. They are languages for the same two events.
Watch the lesson first, then use this page as the written map.
What this model is for
One crowded chart asks too many questions at once. Is this a trend or a pause? Is the push a breakout or a trap? Should you buy the first candle, wait for a pullback, or wait for a completely different pattern? Where does the idea stop making sense?

Most lessons answer one of those questions and then add another label. Before long the chart is full of information and the decision is still missing.
The range model separates three jobs:
- See the environment. Where has price stopped making progress? That pause is the range.
- Choose the setup. Did the boundary get swept and rejected, or did price leave the box and hold the retest?
- Manage the risk. What price proves the idea wrong, and can your size live with that distance?
The model does not tell you to click buy every time price touches a line. It tells you where a decision has weight, and what evidence you need before you risk money.
That is also why older methods still appear in Stoic Edge teaching. Moving averages help describe when a chart is overlapping versus expanding. SBS describes a manipulation-and-reclaim sequence that often lives at a boundary. Fib geometry is one mechanical way to measure the same box. ICT, SMC, Wyckoff, turtle soup, order blocks, and fair-value-gap language can name pieces of the same events. The range stays in the background because the market keeps moving between consolidation and expansion.

Start with risk, then the chart
Trading is not the act of decoding a hidden algorithm. It is the act of buying or selling while a defined amount of money is at risk.
Before an order exists, write three things:
- the amount you are willing to lose if the idea is wrong;
- the price that proves the idea wrong;
- the size that matches the distance from entry to that price.
One R is that pre-committed loss. Targets, partials, and trailing decisions can be discussed in relation to that unit. Your personal dollar amount is your decision. This guide does not supply one.
If the stop is too wide for the risk you can accept, reduce size or pass. If you cannot explain the invalidation, you are still studying the chart. One clearer signal is not a substitute for a smaller, defined risk.
No risk plan, no trade. The range helps you find a location. It cannot decide what you can afford to lose. See the stop-loss and position-sizing guide for the arithmetic this article leaves to your account plan.
Mark a range you can defend
One range is the place where price has stopped making one-way progress and has traded both directions. Mark:
- range high
- range low
- range mid (the 50% of that height)
The box should be obvious on the chart you are actually using. There is not one correct measurement for every swing. Two traders can draw slightly different boxes on the same candles. What matters is that you can defend the boundary you are using before the next response, not after the move has already completed.
Practical tells that a range is forming:
- repeated reactions at a high or a low;
- sweeps of a prior extreme that return inside;
- overlapping candles instead of a one-way run.
Do not wait for a perfect rectangle. Buyers and sellers will not produce a textbook box on demand. Observe the reaction at the boundary you marked. That reaction is the evidence. Prediction of what they “must” do next is not.
As the chart develops, ranges often grow. One small pause can become a larger pause. One failed break that travels all the way to the opposite side can force you to rebuild the box. Mark the live range, not the range you wish you had drawn last week.
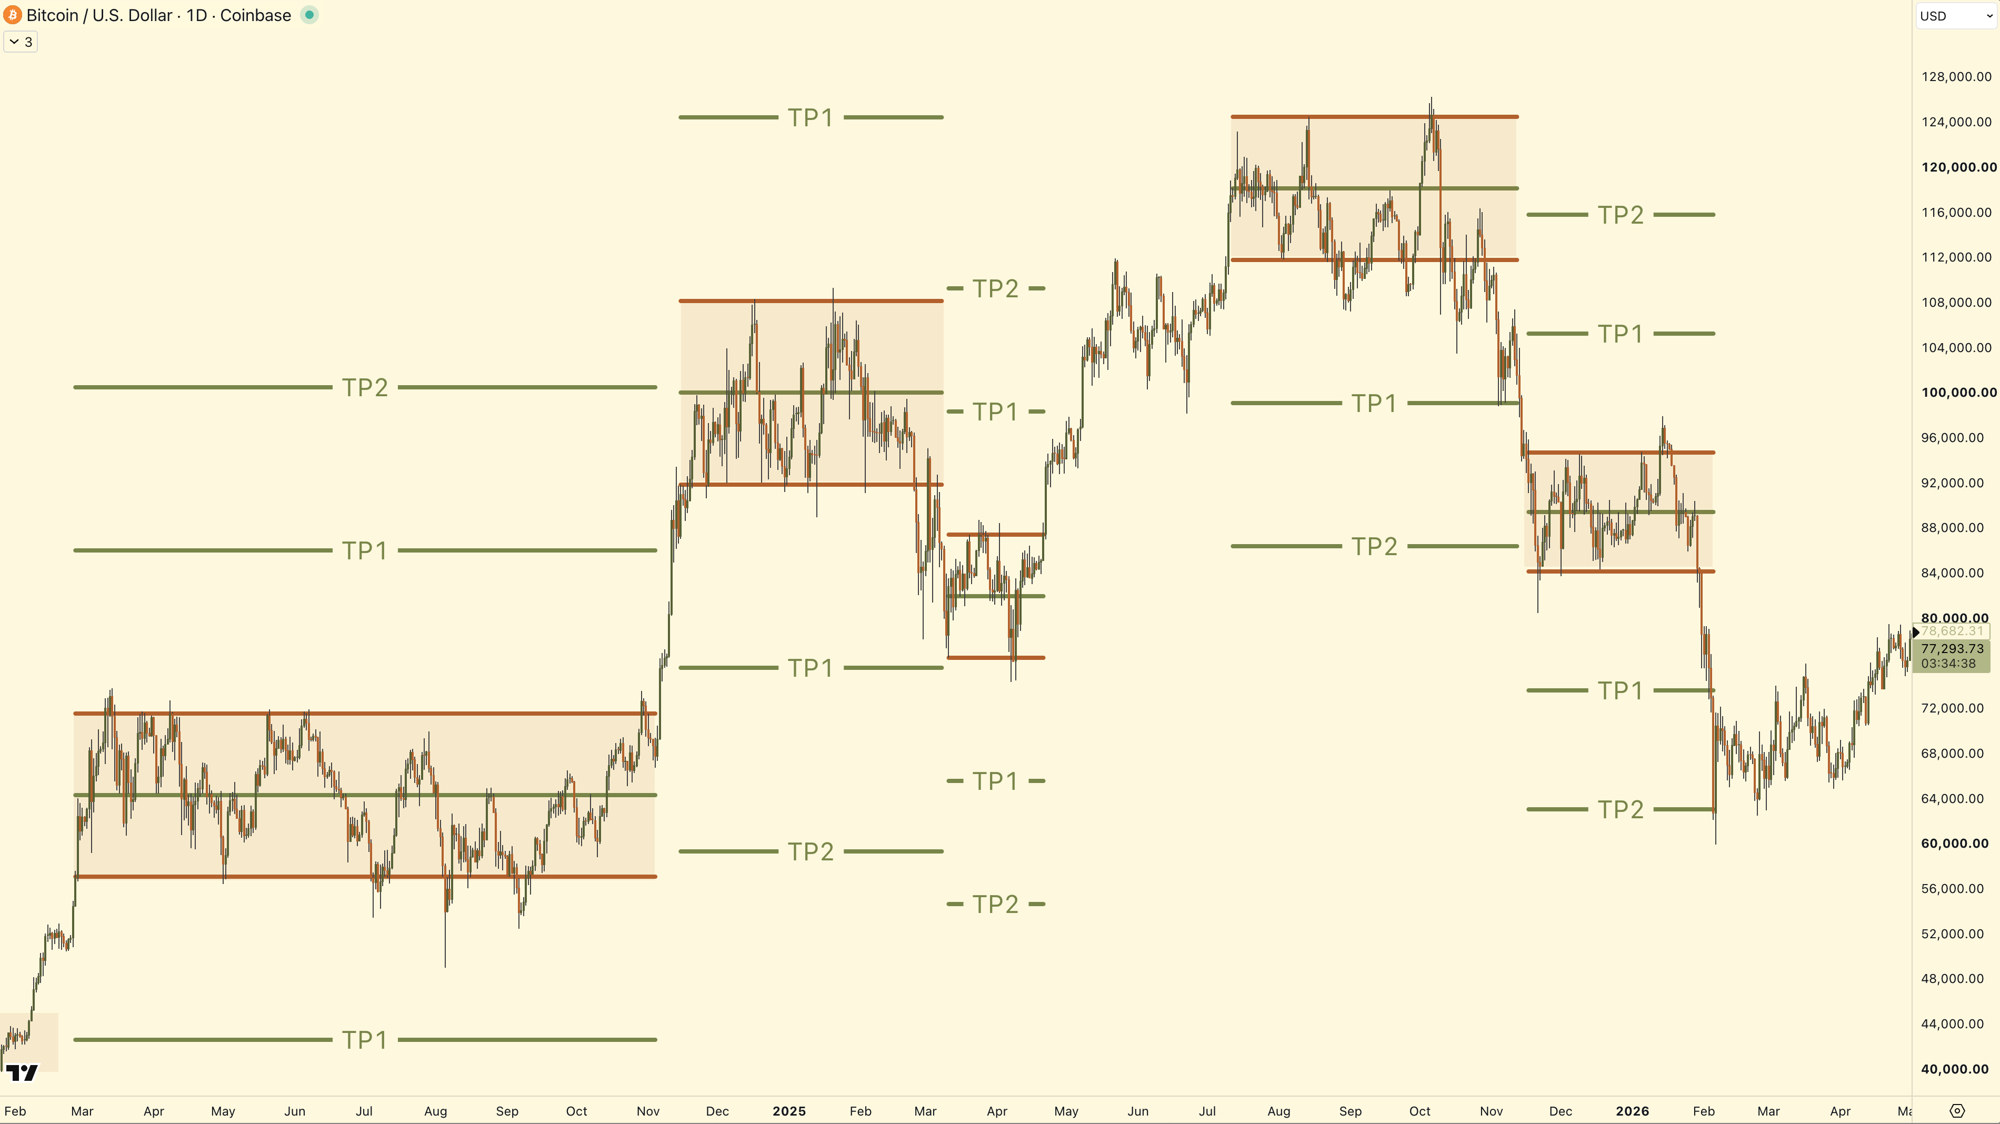
Bitcoin / U.S. Dollar, daily, Coinbase.
Setup 1: Sweep and retest of the range
One sweep is a push beyond the marked high or low that does not hold. Price trades outside the box, then comes back inside.
That observation is the same family of event described in the swing failure article: a break of a visible swing followed by a return. The candle records traded prices. It does not prove who was trapped, how many stops sat at the level, or that the next move must reverse.
For the range model, the teaching sequence is:
- The boundary is already marked.
- Price pokes through it.
- Price reclaims the inside of the box.
- The first measuring target is the mid.
- The second measuring target is the opposite boundary.
The retest is part of the setup. One wick through the line with no return is not yet a sweep-and-retest. One return that immediately fails back through the boundary has not held.
The lesson treats the sweep as the first setup to study. One close through a boundary often comes back inside. That is a teaching bias, not a measured failure rate for every market and timeframe. Record both the sweeps that delivered to mid and the sweeps that did not.
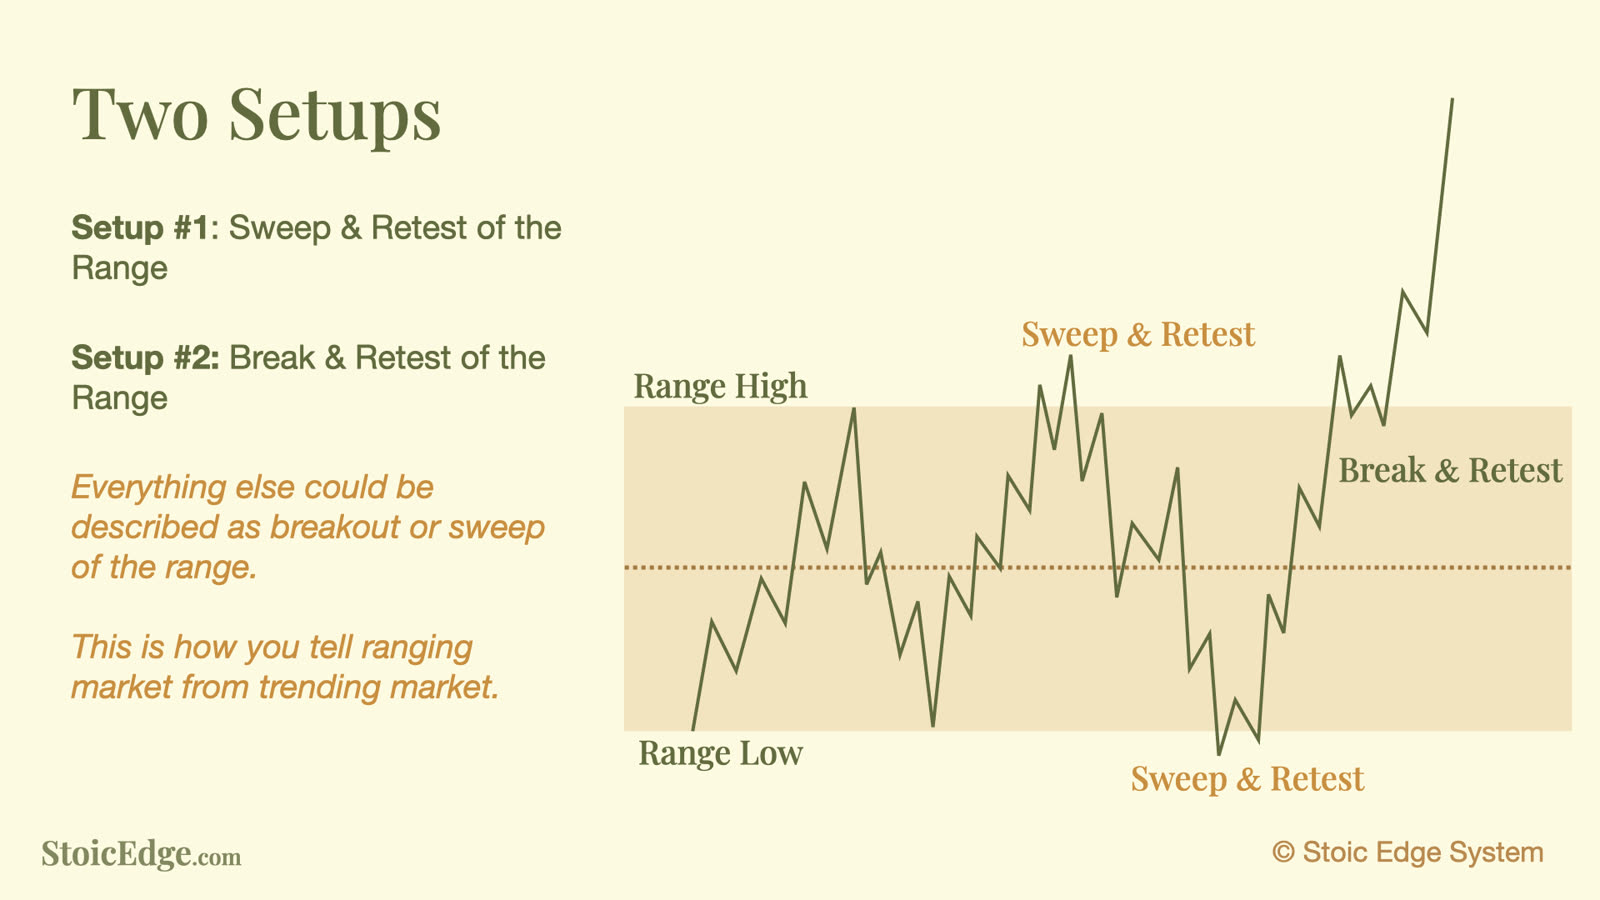
Setup 1 fails to hold outside the box. Setup 2 leaves the box and holds the retest of the broken side.
Setup 2: Break and retest of the range
One break-and-retest requires more than a close outside the box. Price must leave, then test the broken boundary from the other side, and that test must hold.
If the retest fails and price travels back to the far side of the original box, you do not have a break-and-retest. You have a failed break. In that case the live range may need to be extended, and the measured targets move with it.
When a break-and-retest does hold, the model measures expansion from the height of the box:
- TP1 = one times the range height beyond the broken side
- TP2 = two times the range height
Those are measuring objectives, not promises. Price can stall, reverse, or run past them. If the chart turns before a projected line, taking the planned management action is part of the trade. Waiting for TP2 is not permission to exceed the original risk.
One Fibonacci tool can draw the same map: 0 and 1 as the box, 0.5 as mid, then 1.0 and 2.0 (or −1.0 and −2.0) as expansion. The tool is optional. Copying the height of the box with any measuring method is enough.
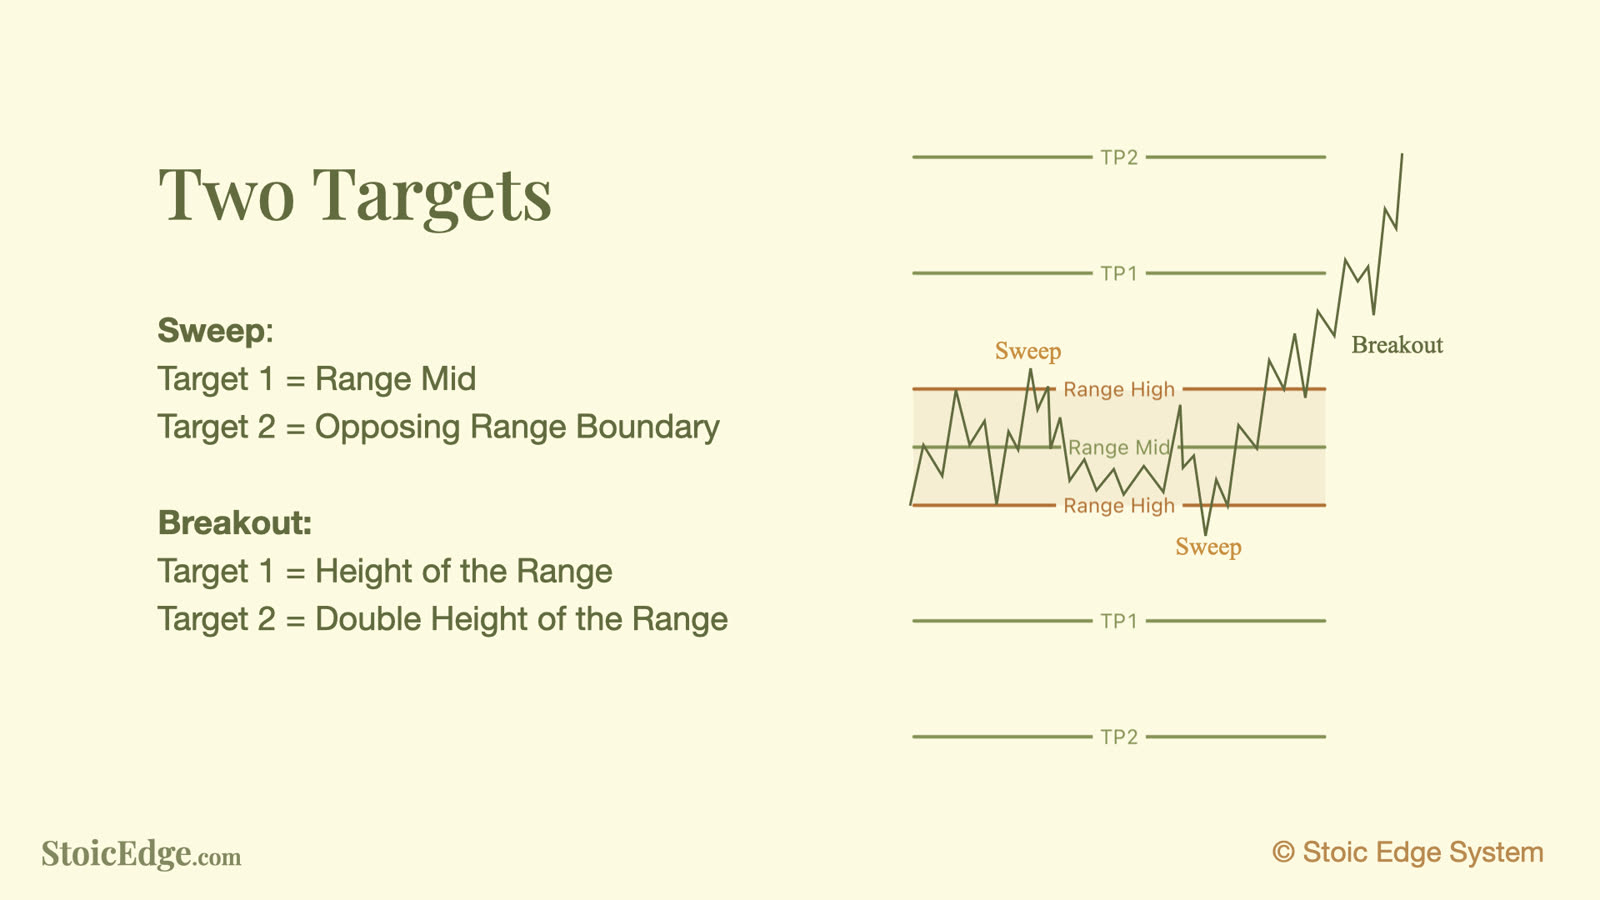
The same range height produces both maps. Which projections you use depends on whether the live setup is a sweep or a held break.
The middle is a target, not a hunting ground
After a sweep, the first objective is the mid. After delivery into that area, the lesson’s default is to wait.
The midpoint is where opposing pressure often meets. Overlapping candles around 50% are common. That chop is not a new setup just because a moving average, a Compass dot, or an order-block label appears there.
Use the mid as:
- a measuring target;
- a place to reassess, take planned partials, or trail according to the written plan;
- a reason to stand down on fresh entries until a boundary is tested again.
Do not use it as a default hunting ground for a new position. If you cannot explain why this particular mid-test is a boundary of a smaller range you have already marked, you are improvising.
Ranges within ranges
The model is fractal. One daily box can contain hourly boxes. An hourly box can contain five-minute and one-minute boxes. The same two setups appear on each scale.
Choose the chart that owns the environment before the session. For a swing idea, that may be daily or four-hour. For an intraday idea, hourly or fifteen-minute often holds the parent box, with five-minute or one-minute used only to refine the response.
Two constraints keep the fractal from becoming an excuse to trade everything:
- A valid lower-chart setup does not repair a broken higher-chart idea.
- A valid higher-chart idea does not qualify a bad lower-chart entry.
If the parent is sitting at its own 50% and going nowhere, forcing a one-minute pattern is usually a location problem, not a missing confirmation. The lesson’s working default is one idea per session. That is a attention rule, not a universal quota. One quiet mid-range day can be a no-trade day.
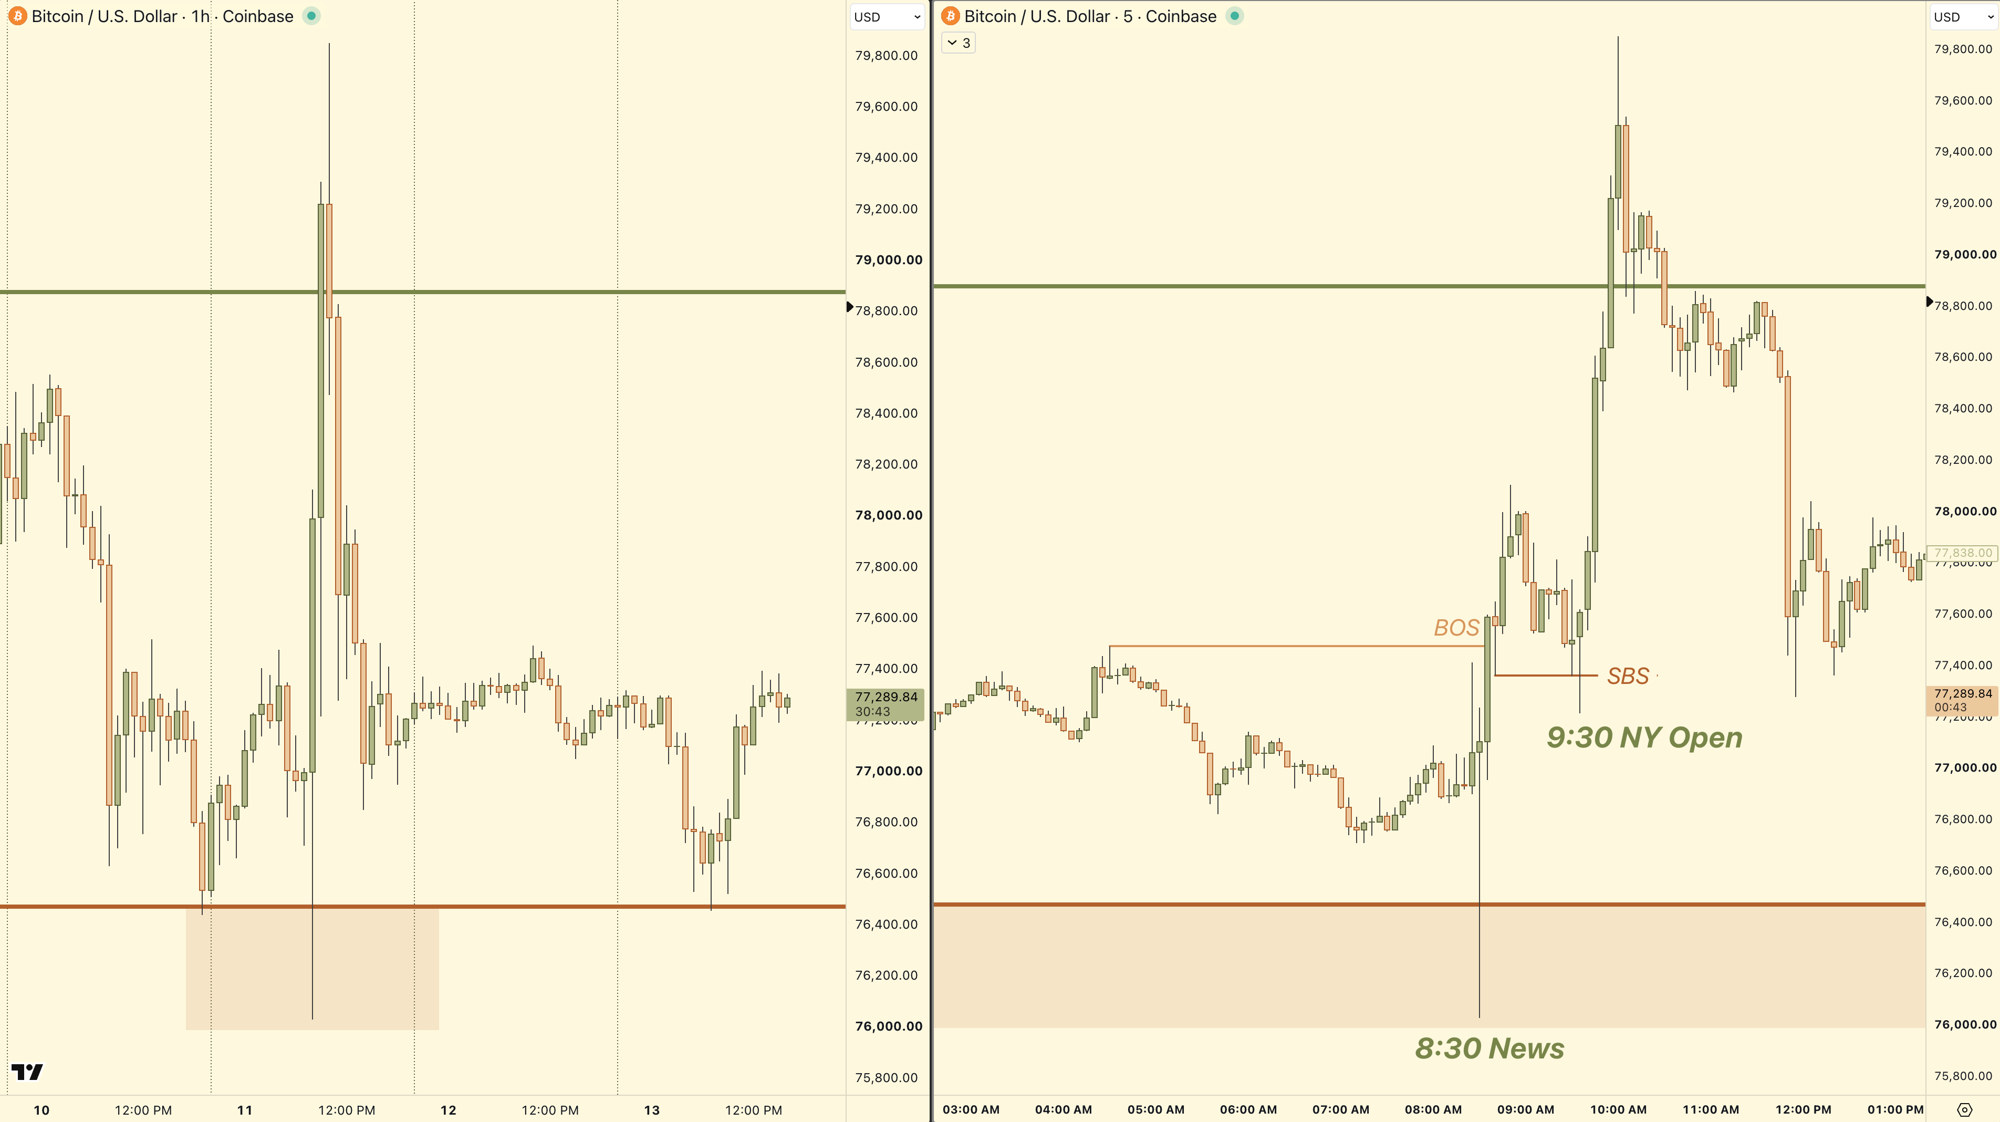
Bitcoin / U.S. Dollar, Coinbase. Left: 1 hour. Right: 5 minute, with BOS / SBS into the 9:30 New York open after 8:30 news.
How other methods fit
Once the box exists, most named patterns are a sweep or a break:
- Swing failure, turtle soup, liquidity grab: sweep of a boundary that returns inside.
- Break and retest, change of character that holds: break of a boundary whose retest holds.
- SBS / manipulation sequence: often the lower-chart story of a sweep, then expansion.
- 1-2-3 and PTB: entry language after the environment is marked.
- Order block, supply/demand, FVG: a label on a response. Still needs the boundary and the risk.
- Moving averages: describe overlap versus expansion; they do not replace the box.
- Fib retracement / projection: one way to draw mid, H, and 2H.
The language does not matter if you cannot point to the live high, low, and mid. If a concept cannot be placed on this map, it is not helping the decision.
One moving-average 1-2-3 or PTB is one way to enter inside the range, not instead of the range. One beautiful PTB in the middle of a parent box is still a mid-range idea.

Worked example: Bitcoin daily environment
On the Bitcoin daily chart used in the lesson, price spends long stretches overlapping, then travels, then overlaps again. That is the whole cycle.
One useful way to watch a daily range form is to mark the first small pause, then update the box when a sweep creates a new extreme that still returns. Several daily sweeps in the walkthrough delivered toward mid over a handful of sessions. One later break of a completed top box was measured with the height of that box; daily price later tagged the 1× and 2× projections and paused again.
Hindsight makes every box look obvious. The useful habit is to freeze the chart when the second side of the pause appears, write the high, low, and mid, and only then watch the next test.
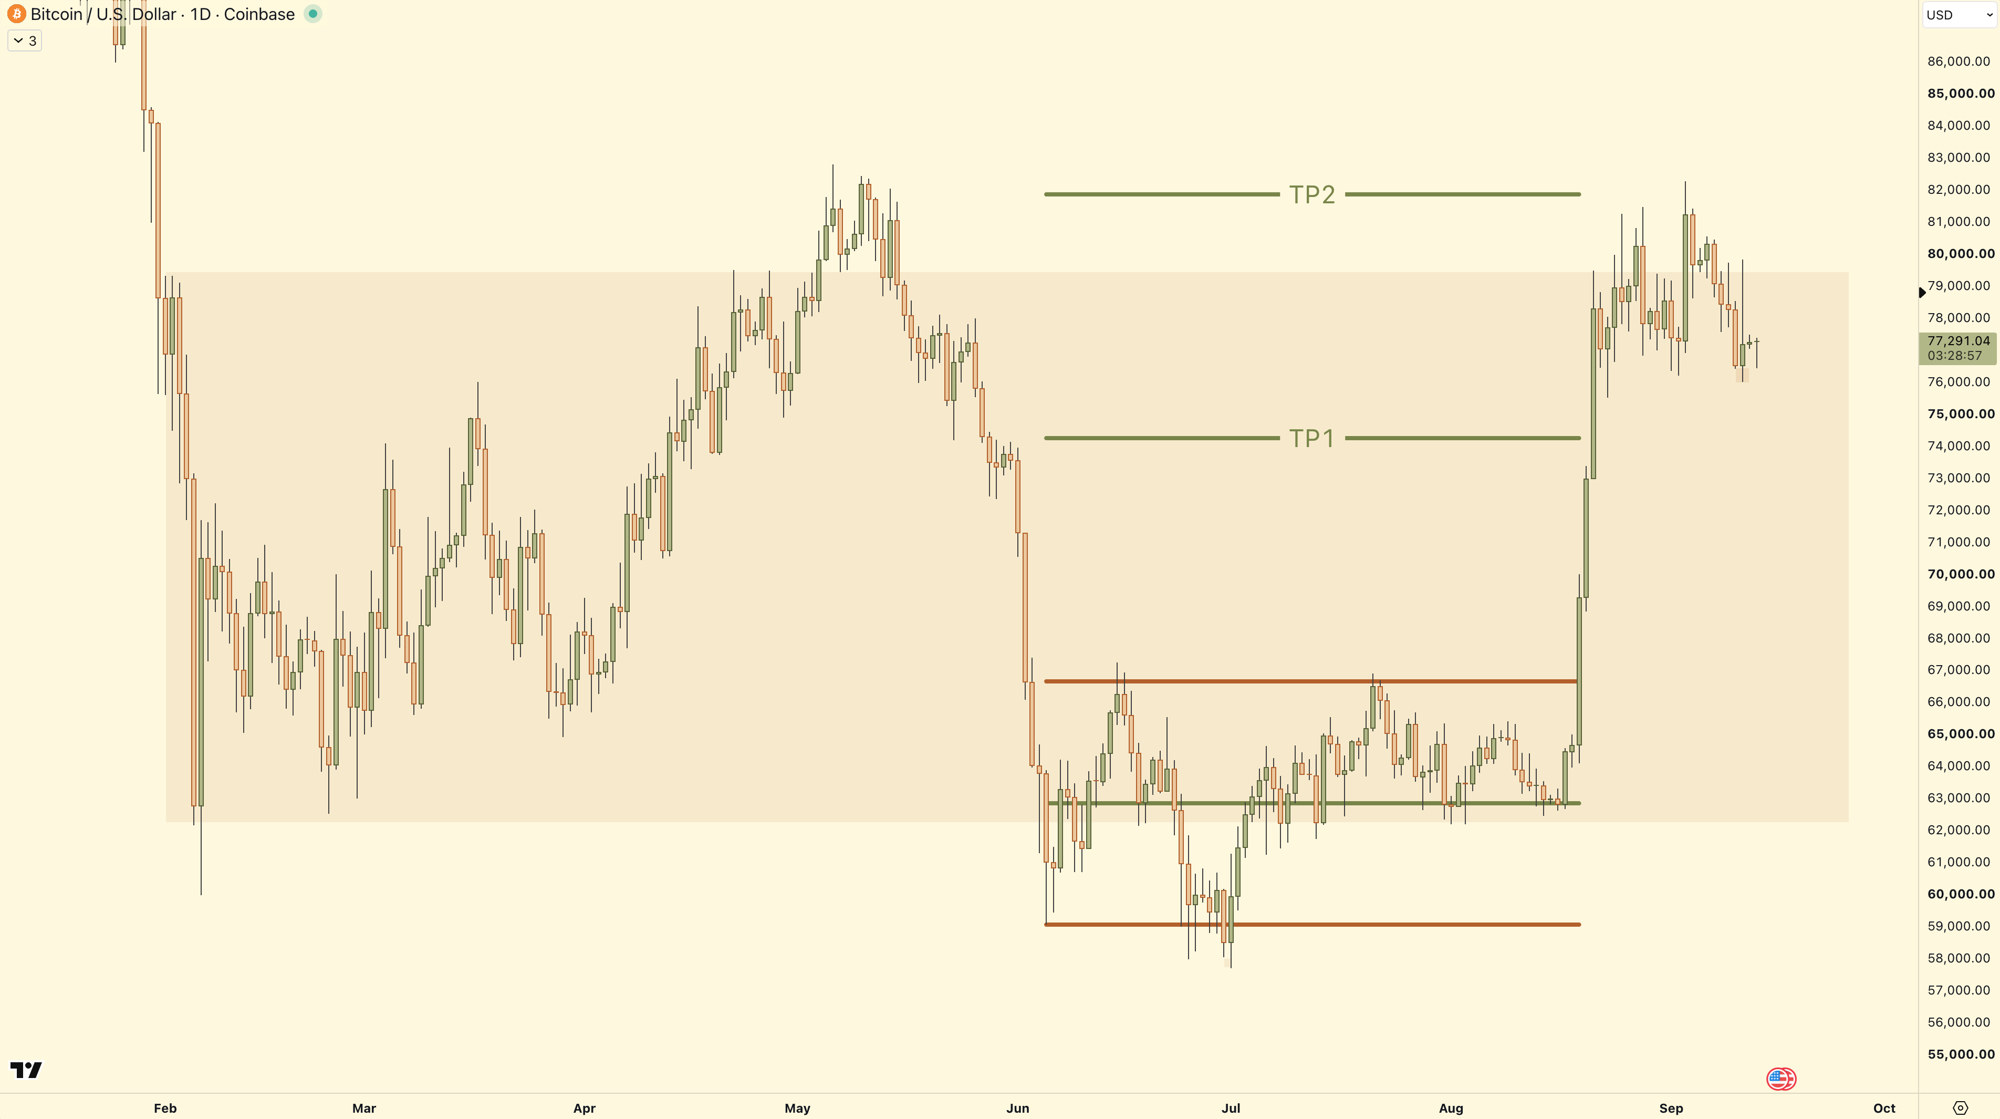
Bitcoin / U.S. Dollar, daily, Coinbase. The larger box is the parent range. The inner box has its own height, mid, and expansion targets.
One later daily sweep of the range high, visible on the hourly chart, is the same setup on a faster scale: poke through the high, return toward mid.
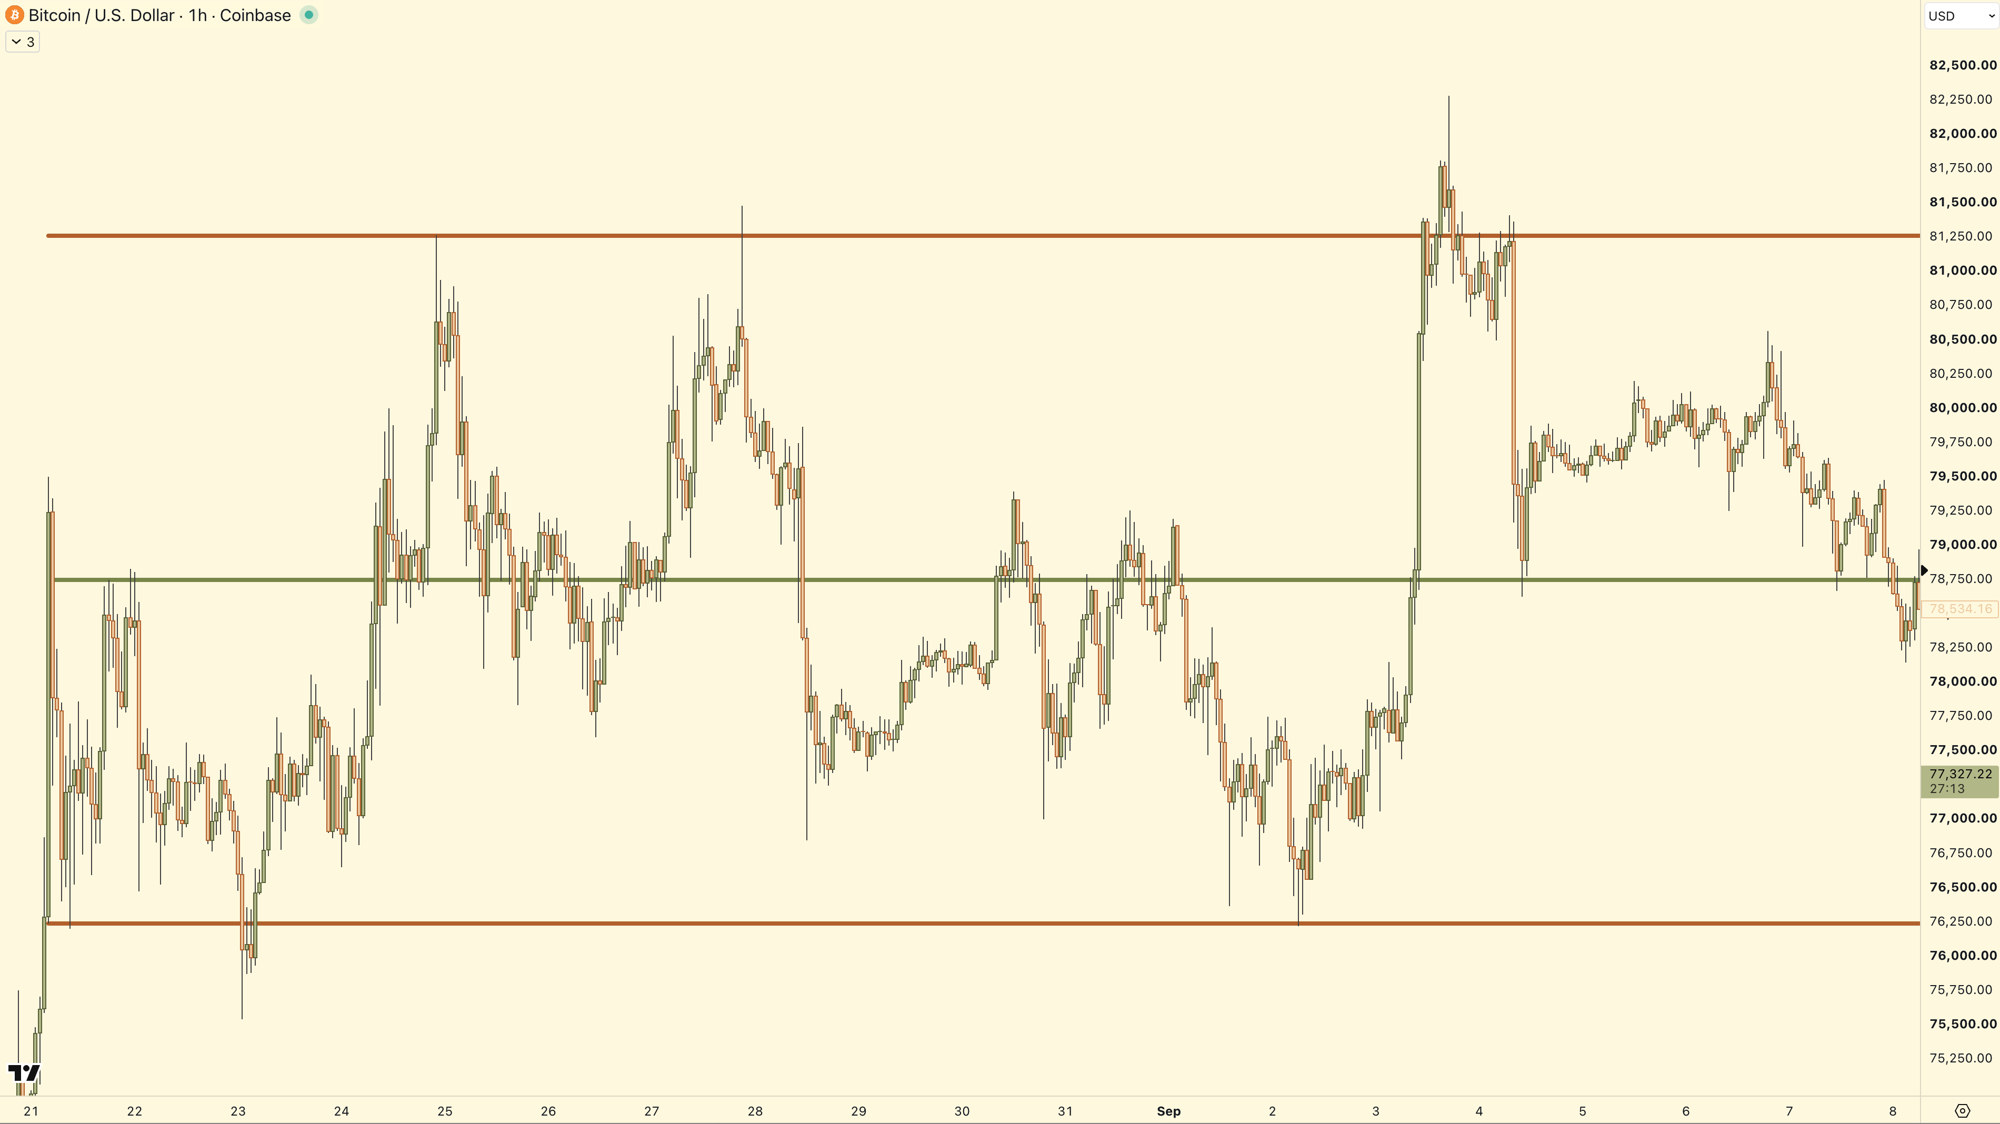
Bitcoin / U.S. Dollar, 1 hour, Coinbase. Early September 2026.
Worked example: a sweep that was too early
Not every poke is a trade. In the lesson’s Friday 4 September 2026 Bitcoin walkthrough, an early short against the developing range was stopped. The later five-minute consolidation, once it had two sides, could be measured as its own small box. Expansion from that small box reached a 2× projection. News at 08:30 and the 09:30 cash open were part of the session; they do not convert the pattern into a news strategy.
The review question is not “was Friday a winner?” It is: was the first short taken before a box existed? If yes, the loss belongs to location, not to the range model.
Include these cases in practice:
- the sweep you took too soon;
- the sweep that returned only part-way to mid;
- the break whose retest failed and forced a rebuild of the box;
- the mid-range chop you correctly skipped.
One gallery of completed expansions cannot tell you how often you will identify the live box in time.
Worked example: wait despite activity
Nasdaq, hourly, from the lesson: several sweeps of a marked range each offered a study of Setup 1 toward mid. One later break-and-retest of the same box was measured to 1× height.
On the lower charts, London and New York both produced candles. The ones that mattered in the teaching were the responses at the hourly boundary. One one-minute pattern in the middle of that hourly box was treated as optional at best. After price had already expanded from mid into the far boundary late in the day, buying a further sweep of that same boundary was labeled too late for that session.
Yellow, overlapping Compass readings around the midpoint were used as a reason to stand down, not as a prompt to scalp the noise. Compass did not make the location valid.
Where Compass fits
Stoic Edge Compass publishes chart context: directional dots after the bar closes, yellow caution when the chart is overlapping or losing momentum, Trend Ribbon, a 200 EMA, and dynamic support/resistance.
In this model:
- yellow clustering inside a box supports wait;
- a color change at a boundary you already marked is supporting context;
- a green or red dot in the middle of the parent range does not create a setup;
- the 200 EMA is a Compass display. It does not replace the System’s 200 SMA rule, and it does not replace the box.
Compass does not choose the entry, stop, size, or exit. Read new markers after the bar closes. If you view Heikin Ashi, still use real prices for risk. See what Compass does not do and the color guide.
Buying Compass is not required to use this article.
Place the stop from structure, then size the trade
Invalidation belongs to the idea you actually took:
- For a sweep-and-retest, the usual structural reference is beyond the sweep extreme, with enough room that ordinary noise around the boundary does not become an accidental exit. That is a judgment to record before entry.
- For a break-and-retest, the usual reference is back through the retest that was supposed to hold.
- If you use a PTB inside this map, the other side of the trigger bar remains the usual PTB stop reference, with visible sweep structure sometimes requiring extra room.
Locate that price first. Then ask whether the smallest practical size still fits your allowed R. Tightening the stop only to make the position affordable changes the setup.
Management is written before the trade, not invented at TP1. The lesson’s demonstrated options include taking the mid or 1× height and walking away, trailing behind later swing points, or holding toward the second measured objective while the original risk is still respected. There is no universal partial fraction in this guide.
Practice the decision before watching the outcome
Use replay with future candles hidden.
- Choose the parent chart and mark one live range: high, low, mid.
- Write whether you are waiting for a sweep-and-retest or a break-and-retest.
- Write invalidation, size, first target, and the condition that would make you pass.
- Advance one candle at a time.
- Record what you would have done at the mid, at a failed retest, and at a messy boundary.
Save screenshots at the mark, at the decision, and after the reveal. Keep losses and no-trades in the sample. If the box keeps moving after you know the outcome, the exercise is still teaching hindsight.
One simple starting drill is one distinction per replay: sweep versus held break. Add PTB or 1-2-3 entries only after that distinction is stable.
Common questions
Is this the Stoic Edge System?
Yes. The Range Model and the two setups are the system. Other named methods are how you might enter or manage once the box is marked.
Where does the 1-2-3 fit?
It is one entry language after the environment is clear. It is not the starting map.
Do I have to wait for a retest?
The named setups include the retest. In a fast expansion you may not get a clean one. If you take a developing break without a completed retest, write that down as a different, more discretionary action. Do not relabel it later as a held break-and-retest.
Is there a correct way to draw the box?
No unique geometry. The range needs to be obvious on the chart you chose, with a high, a low, and a mid you can defend before the next test. Ranges inside ranges are allowed; switching boxes after the result is not.
Should I trade the 50%?
As a target, often. As a default entry location, no. One mid-test is a new trade only if it is also a boundary of a smaller range you already marked, with its own invalidation and room.
Does this work on every market and timeframe?
The cycle — consolidation, expansion, consolidation — is a way to describe charts. This guide establishes no verified expectancy, win rate, or typical R multiple on Bitcoin, Nasdaq, or any other instrument. Session, costs, execution, and consistent classification all have to be tested in your own work.
What about the R multiples shown in the lesson?
Illustrated distances on one walkthrough are not a typical result and not a target you should copy onto a different chart. Size from your own stop and allowed risk.
Where should I study next?
- This page — the system: environment, two setups, two targets.
- Swing failure — the sweep observation in more detail.
- Stop-loss strategy — invalidation and size.
- Optional: Compass documentation.
Public education does not require buying Compass or joining the community.
Put the range map to work
Use the break-and-retest guide to connect a smaller entry pattern to the parent range. The profit-target guide explains how the target changes after a sweep or a breakout.
For the decision before and after a trade, see conditional planning and when to stop trading. Each guide includes a historical example from Stoic Edge Weekly.
Stoic Edge provides education. Historical examples and practice exercises do not establish future performance.
Watch the source videos
Study the original demonstrations alongside this guide. Recording dates and historical context appear on each video page.
Put the Lesson Into Practice
Study the course, keep notes and review trades in Stoic Journal beta, and learn alongside the Stoic Traders community.
Compare monthly and yearly course access before joining on Skool. Compass is included while monthly membership is active; yearly Premium includes lifetime course and Compass access. You can also get Stoic Edge Compass separately.
