Jump to a section
Compass guide

How to use Stoic Edge Compass

Stoic Edge Compass is an invite-only TradingView indicator for discretionary traders. It brings directional dots, yellow caution warnings, Trend Ribbon, a 200 EMA and Dynamic Support/Resistance onto your chart. Read new markers after the bar closes, then apply your own setup and risk rules. Compass does not choose the entry, stop, size, or exit. Access is $49 per month or $497 per year.

Start with the latest Green, Red, or Yellow after the current bar closes. Check the chart context, then wait for a setup that fits your plan.

Updated · Stoic Trader

Compass gives you chart context. You still choose every setup, entry, stop, position size, and exit.

Learning the Stoic Edge System? The Range Model is its foundation: two setups and two targets. Compass adds context to that map. Read the free Start Here guide before adding another chart tool.

Update your chart

Already using Compass? Refresh TradingView and check the indicator settings for Trend Ribbon and 200 EMA. If the older version remains, note your display preferences, remove that chart instance and add Stoic Edge Compass again from your invite-only scripts. Recreate existing Compass alerts to use the updated version.
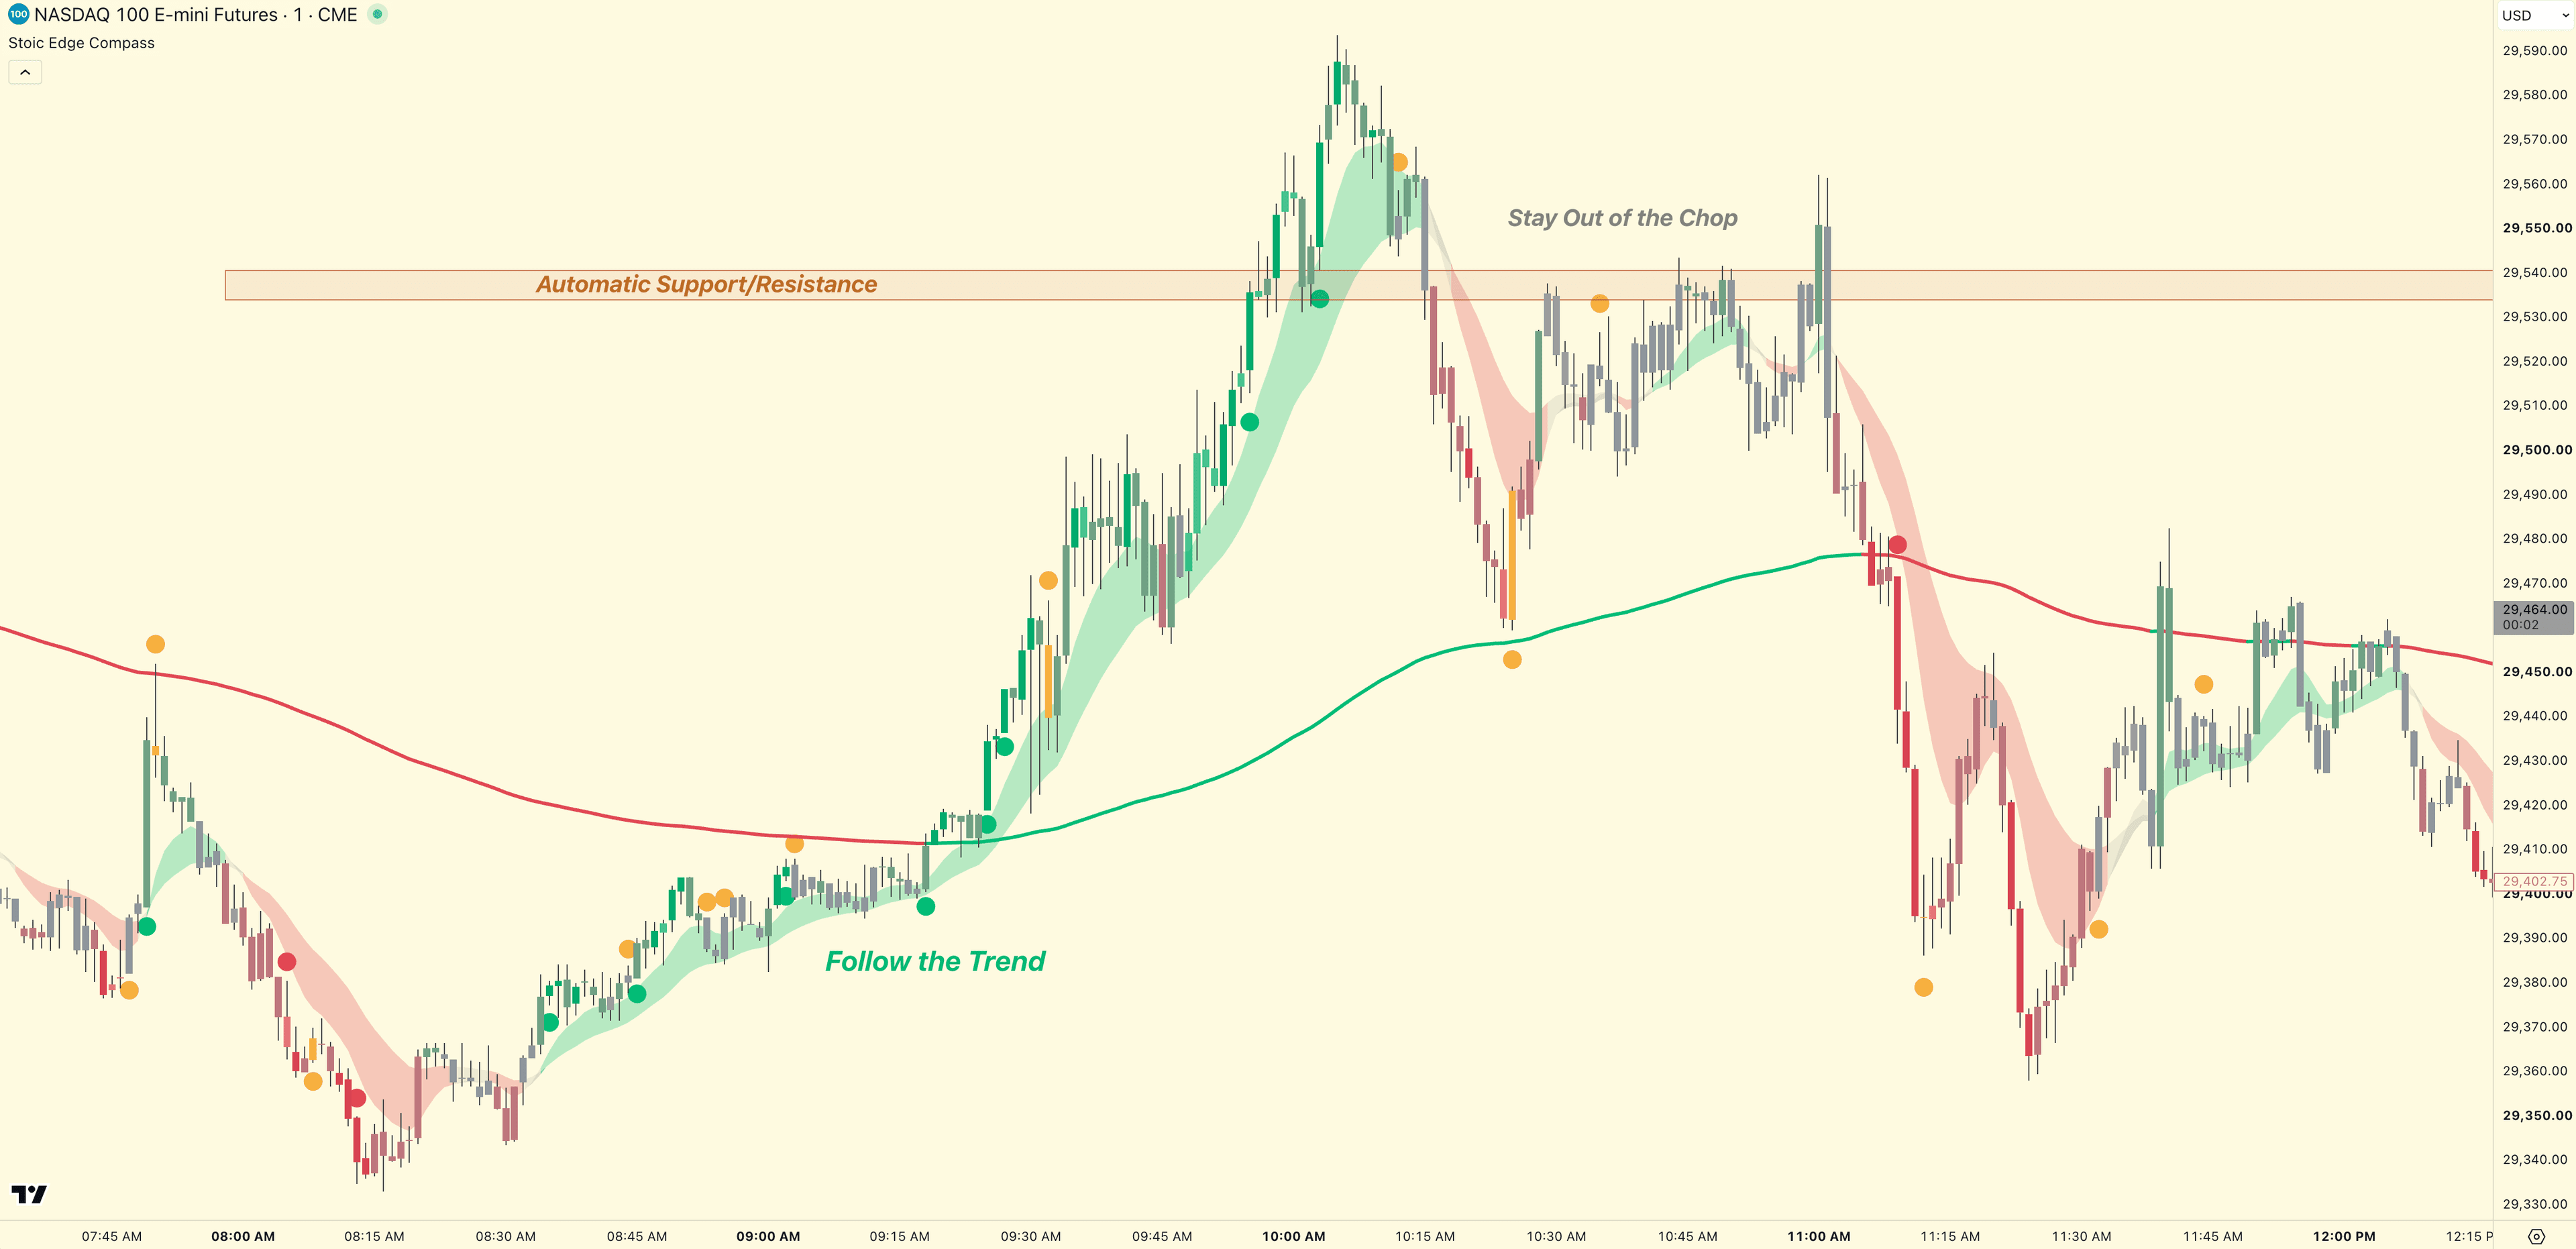
Nasdaq 100 futures one-minute TradingView chart with Stoic Edge Compass directional dots, yellow caution dots, Trend Ribbon, a green and red 200 EMA, and a resistance zone. Annotations identify a trend and a choppy period.
Nasdaq 100 futures, one-minute chart, supplied September 9, 2026. The annotations illustrate a trend, a choppy period and a resistance zone. This chart explains the display; it is not a performance result.
Open full-size chart (new tab)

Read the latest color

What do Green, Red, and Yellow mean?

Green, Red, or Yellow comes first. Treat the color as the first piece of context. Your setup decides whether a trade is available.

Green

Favor long setups

Use Green as bullish context. Continue only when a long setup from your own plan is present and the risk fits.
Red

Favor short setups

Use Red as bearish context. Continue only when a short setup from your own plan is present and the risk fits.
Yellow

Slow down

Pause and reassess before considering another trade. Yellow is caution and does not predict a reversal.
Compass color meanings and the decisions that stay with the trader
ColorMeaningYou still decide
GreenFavor long setupsWhether a long setup in your plan is actually present, and how much risk to take.
RedFavor short setupsWhether a short setup in your plan is actually present, and how much risk to take.
YellowSlow downWhether to wait, reduce activity, or skip the chart until your setup is clear.

What does each feature show?

Use the layers that fit your process. Start with the default settings and change one display option at a time.

Directional dots
Green gives bullish context; red gives bearish context. Read new dots after the candle closes, then look for a setup that fits your plan. Some conditions may leave you without a new directional dot.
Yellow caution dots
Yellow draws attention to an extended move, slowing momentum or an established range. Pause and review the surrounding price action before adding risk. Range and slowdown warnings are always enabled. Yellow does not predict a reversal.
Trend Ribbon
The ribbon gives a quick view of bullish, bearish or mixed trend context. Use it to follow the move and notice when the picture becomes less clear. Show or hide it in Chart settings.
200 EMA
The bold line is green when real price is at or above the 200 EMA and red when price is below it. It updates as price moves. Adjust its width or turn off Price colors for a neutral line.
Momentum Candles
Candle colors help you see momentum strengthening, slowing or becoming mixed. Start with the default palette, then customize the colors to suit your chart.
SBS triangles
SBS triangles highlight potential liquidity-sweep setups. The settings tooltip calls them Engineered Liquidity Sweeps. Review the price action and your own entry criteria; a triangle is not proof of who traded or an order to enter.
Dynamic Support/Resistance
Highlighted zones mark areas to watch as price approaches or revisits them. Review a hold, rejection or break in the context of your setup. Zones can fail.
Multi-Timeframe Alignment
The optional table lets you compare context across timeframes. Use it to notice agreement or conflict with the chart you trade. Its readings are not probabilities, and developing readings can change.

How do I get access?

After payment, sign in with your purchase email and check your exact TradingView username. Allow up to 48 hours after payment and a valid username are received for the manual invitation. Once approved, add Compass from TradingView's invite-only scripts.

Active Stoic Traders membership already includes Compass. Sign in to check your access before buying a separate subscription.

For a missing invitation or incorrect username, email stoic@stoicedge.com from your purchase address. Include your TradingView username; keep passwords and payment-card details private.

Sign in to check access

How do I use Compass each session?

Use the same order every time so the color, the chart, and your plan stay in one sequence.

  1. 1Choose the symbol, timeframe, and session used by your trading plan.
  2. 2Wait for the current bar to close, then read the latest Green, Red, or Yellow state.
  3. 3Check whether the rest of the chart supports the same idea.
  4. 4Wait for your own setup and entry criteria before acting.
  5. 5Set the stop, position size, and exit plan before risking capital.

When the market ranges

When price keeps moving back and forth through the same area, give it room to resolve. Yellow range warnings are a reason to review or wait. If your plan includes trading range boundaries, require your own setup at the boundary; the dot does not supply an entry or guarantee a breakout.

Should I use TradingView alerts?

Choose Green or Red for directional-dot alerts, Yellow for extended-move exhaustion warnings, or Range established for a range warning. Yellow does not cover every yellow dot; slowdown dots have no separate alert. Use Once Per Bar Close where available, then open the chart to review the event.

After an indicator update, recreate existing Compass alerts so they use the updated version.

When an alert fires, open the chart after the bar closes. Read the current color, check the chart context, and run through your own setup and risk checklist.

How should I set up the display?

Use standard or Heikin Ashi candles with Stoic Edge Compass. Choose the display you find easier to read and keep the symbol, timeframe and session consistent when comparing charts. Use real market prices for orders and risk calculations.

Dots
Choose dot size and Bull, Bear and Caution colors. Range and slowdown warnings stay enabled.
Chart
Show or hide Trend Ribbon, 200 EMA, SBS triangles and Dynamic Support/Resistance. Adjust EMA width and Price colors.
Momentum Candles
Show or hide candle coloring and customize the Bull, Bear, muted, Caution and Neutral colors.
Multi-Timeframe Alignment
Show or hide the table, then choose its position and text size.

What does Compass not do?

We do not publish a verified trading-performance record for Compass. Examples illustrate its features and use; they do not establish expected returns.

  • Read new Compass states after the current bar closes.
  • Use every marker as chart context, never as an automatic entry.
  • Markets can reverse, consolidate, or move unexpectedly after any reading.
  • Keep the same symbol, timeframe, session, and settings when reviewing a past decision.

Guides for specific questions

Start with the Stoic Range Model, the foundation of the Stoic Edge System.