By Stoic TraderUpdated
How to read Green, Red, and Yellow on Compass
Read directional dots, yellow range and momentum warnings, and the color-changing 200 EMA alongside your own setup and risk plan.
Read Green, Red, or Yellow after the current TradingView bar closes. Green favors long setups, Red favors short setups, and Yellow means slow down. Then check the chart and wait for a setup from your own plan.
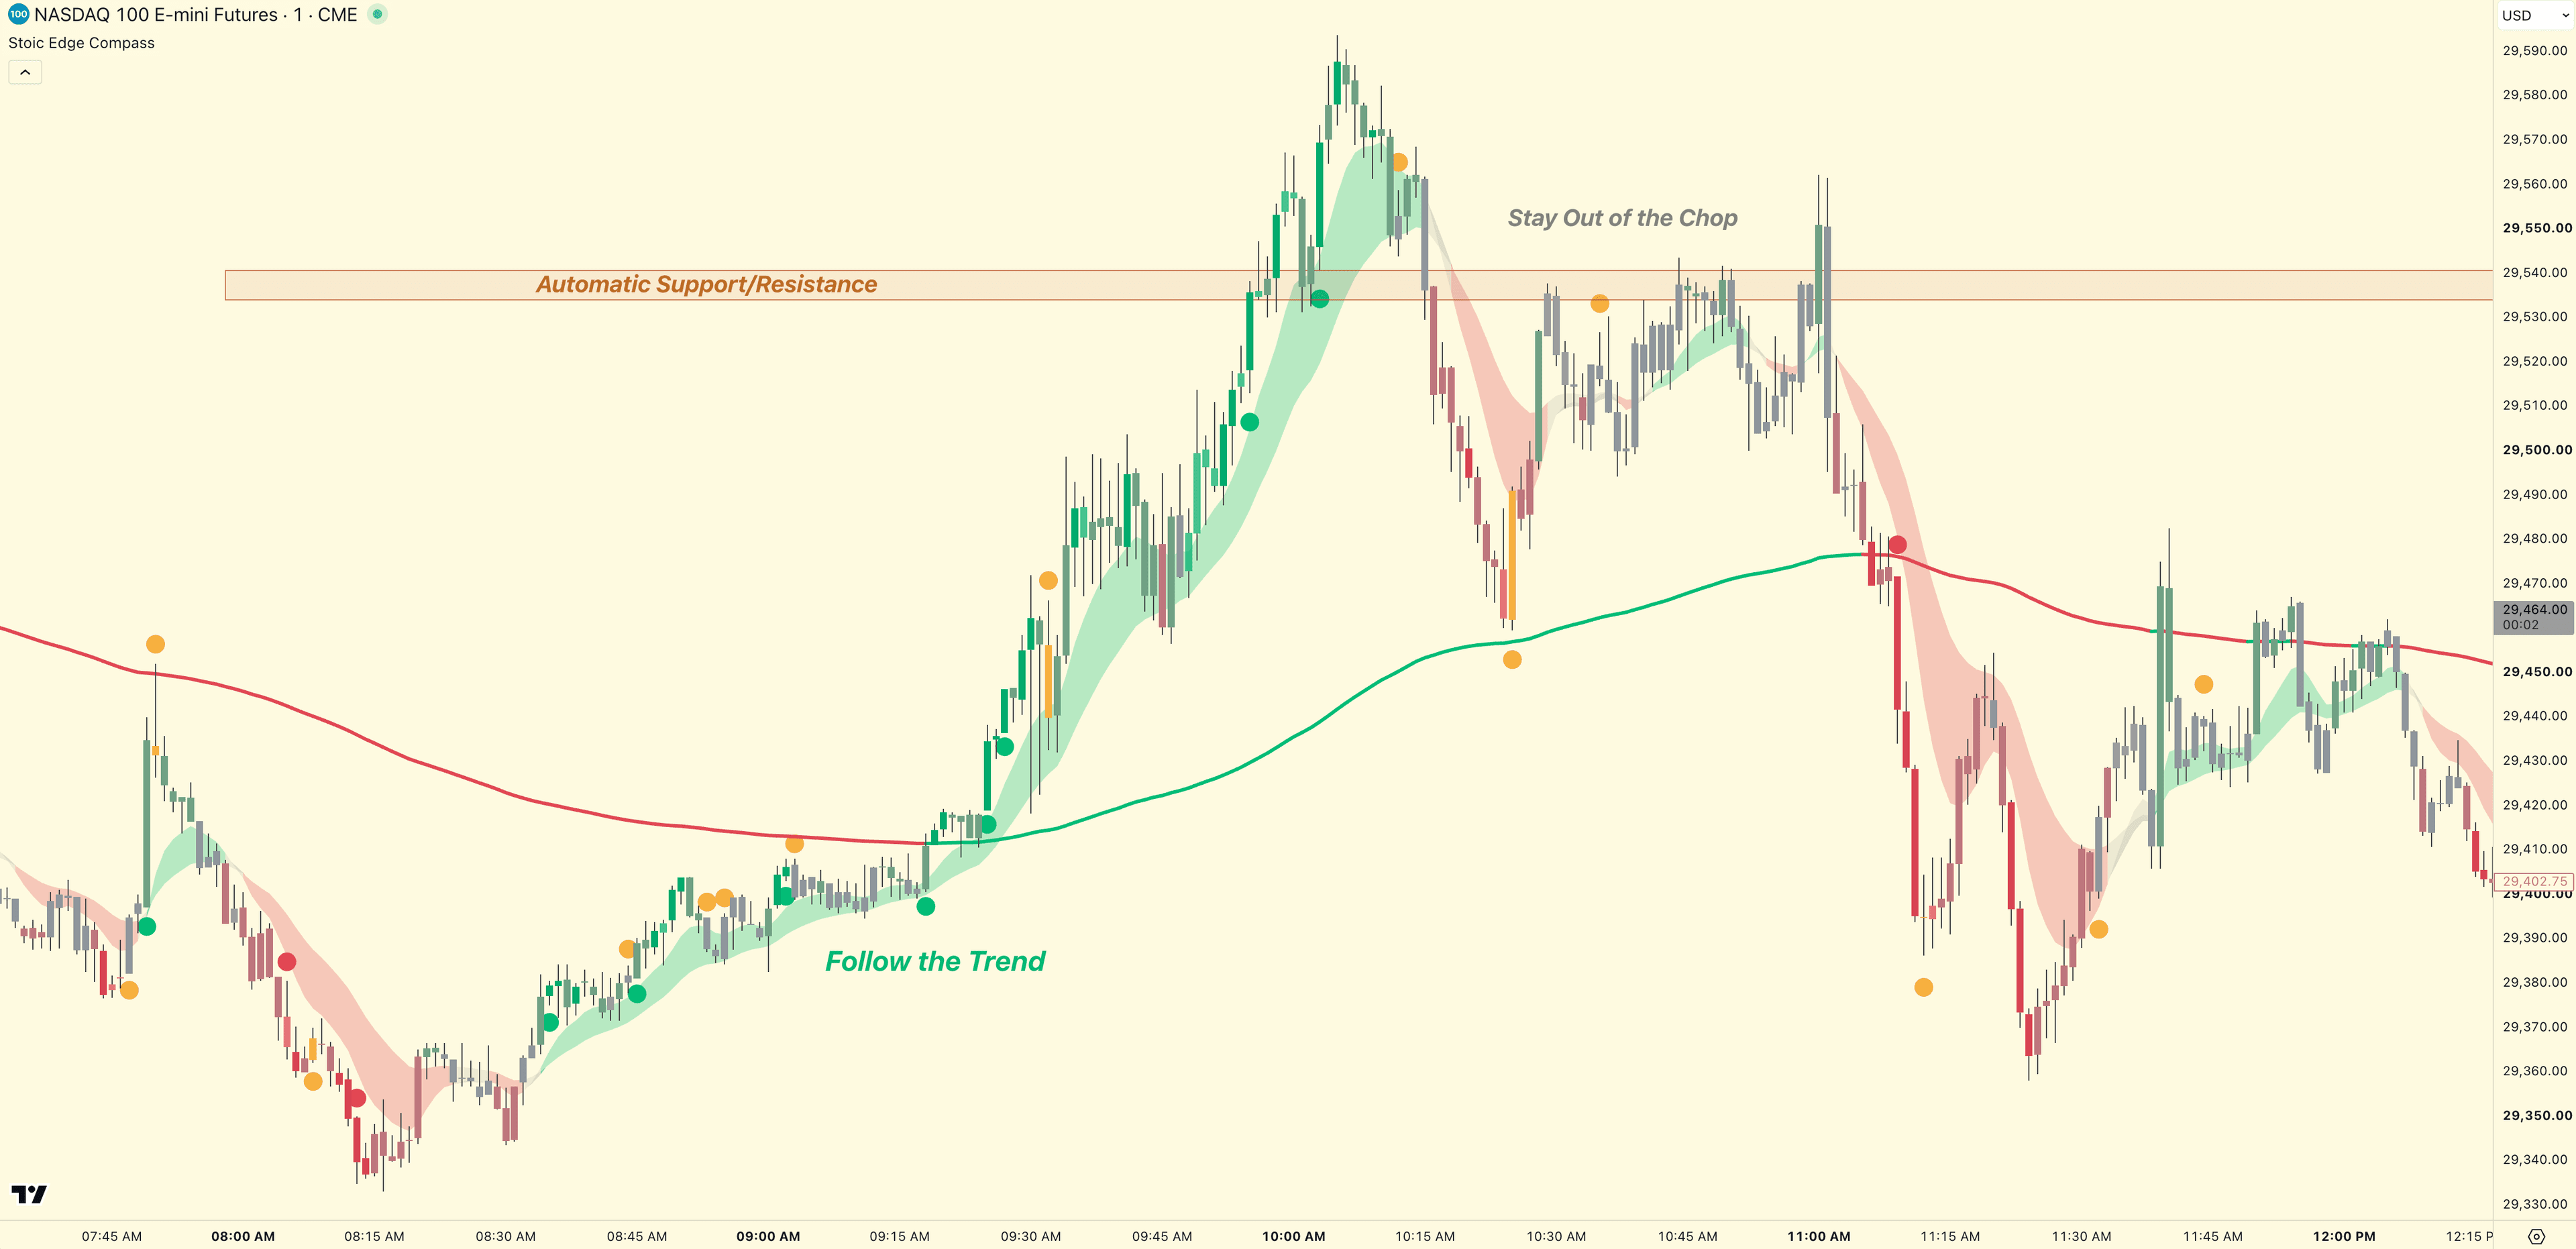
Color meanings
| Color | Meaning | You still decide |
|---|---|---|
| Green | Favor long setups | Whether a long setup in your plan is actually present, and how much risk to take. |
| Red | Favor short setups | Whether a short setup in your plan is actually present, and how much risk to take. |
| Yellow | Slow down | Whether to wait, reduce activity, or skip the chart until your setup is clear. |
Yellow warnings and ranges
Yellow draws attention to an extended move, slowing momentum or an established range. Pause and review the surrounding price action before adding risk. Range and slowdown warnings are always enabled. Yellow does not predict a reversal.
When price keeps moving back and forth through the same area, give it room to resolve. Yellow range warnings are a reason to review or wait. If your plan includes trading range boundaries, require your own setup at the boundary; the dot does not supply an entry or guarantee a breakout.
The 200 EMA color is a separate reference
The bold line is green when real price is at or above the 200 EMA and red when price is below it. It updates as price moves. Adjust its width or turn off Price colors for a neutral line. Its color describes price relative to that line; it is not another directional dot.
When to read a new color
Read new directional markers after the bar closes. Then read the latest color, then compare it with the market, timeframe, and setup already in your plan.
Three decisions to keep separate
- Green context with an extended price or poor room can still mean no trade.
- Red context does not authorize a short without your setup and risk checks.
- Yellow asks you to reassess. It does not predict a reversal or tell you to enter the opposite direction.
Yellow dots and alert conditions
Yellow dots can reflect extended-move exhaustion, slowing momentum, or an established range. The Yellow alert covers extended-move exhaustion; established-range warnings have a separate alert. Slowdown yellow dots do not have a matching dedicated alert. Use Once Per Bar Close where available.
See the full feature and alert reference and the Stoic Range Model for the separate decisions made by the indicator and the trading framework.
Complete Compass documentation
Get Stoic Edge Compass
Standalone access is $49/month or $497/year.
Compass is included while monthly Stoic Traders membership is active, or for life with yearly Premium. Compare membership options, or sign in to check your existing access.