Start here
One range. Two setups. Two targets.
The Stoic Range Model is the foundation of the Stoic Edge System. Mark the high, low and middle. Then study what price does at a boundary before choosing an entry.
The article and video are free. Compass and community membership are optional.
Watch the Range Model lesson
Mark the range first
Price consolidates, expands, then consolidates again. Choose the chart that owns your idea and mark a range you can explain before the next move. Keep its high, low and midpoint fixed for the decision you are studying. If the evidence changes, record why you changed the box.
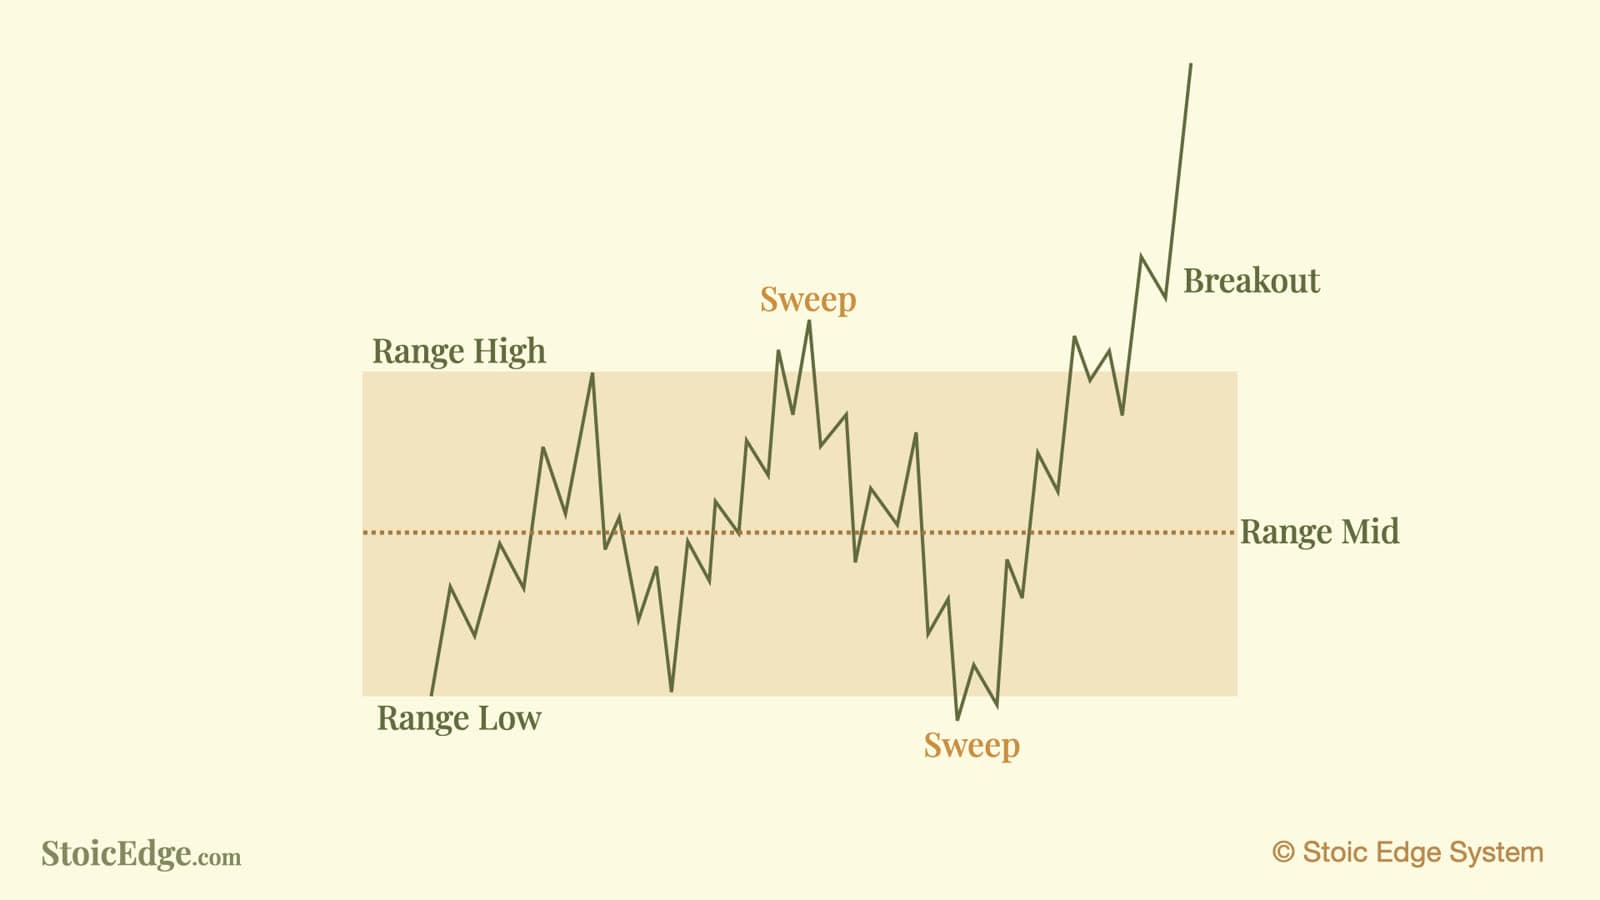
Two responses to study
These targets are measuring objectives. Price can turn before reaching them. Touching or closing beyond a line does not complete a retest. Define invalidation, size and management before entry, and wait when the response is incomplete.
Where the other methods fit
SBS, Golden SBS, 1-2-3 and PTB describe or time entries once the range and location are clear. FibGeometry measures swings and expansion; moving averages add context. Each method keeps its own entry and management rules inside the same range map.
Compass adds chart context through its dots, caution states, ribbon and levels. It leaves the entry, stop, size and exit to your plan. Signals in the middle of the parent range do not create a new boundary setup.
Choose your next step
Keep learning the model, add Compass to your chart, or study its application in Stoic Traders.
Active Stoic Traders membership includes Compass. Standalone Compass does not include the community or full lesson bundle. Paid subscriptions renew until canceled; review the terms at checkout.