Technical Analysis Basics: Read Structure Before Adding Indicators
Learn a simple technical analysis process using highs, lows, ranges and retests, with a chart exercise you can repeat without hindsight.
3 min read
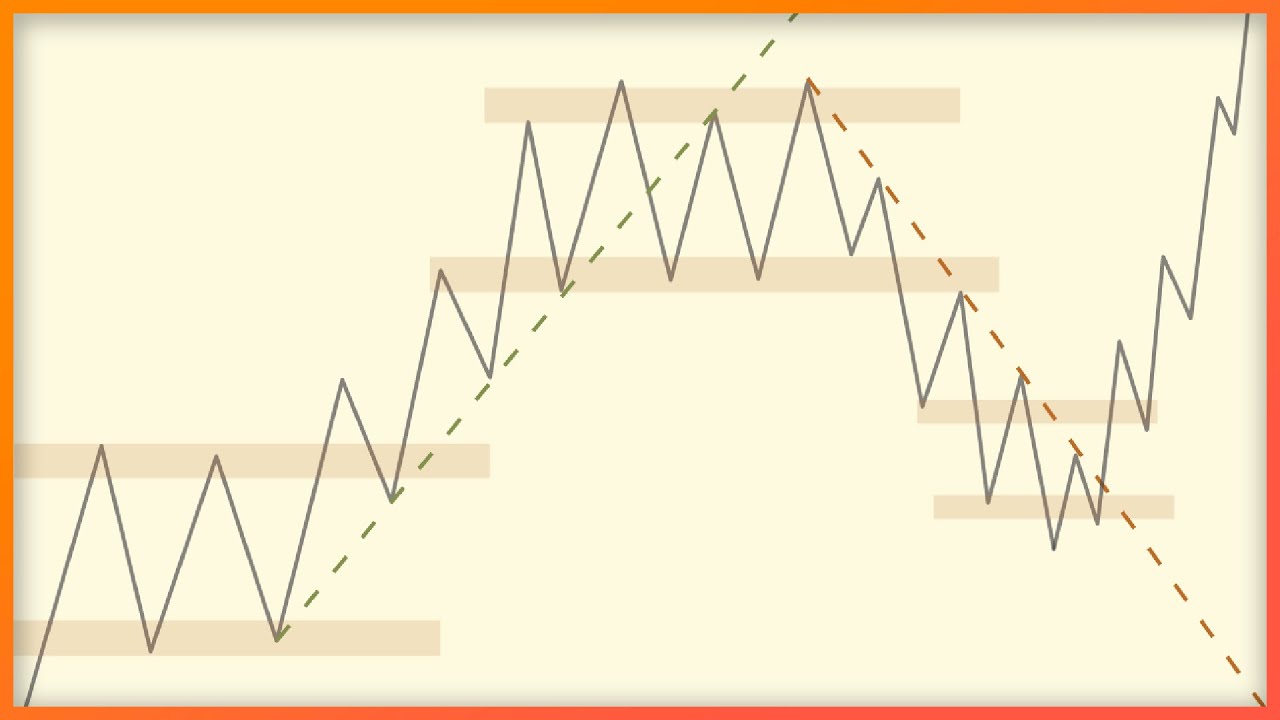
Technical analysis becomes harder to use when every candle gets a new explanation. Start with a smaller question: is price still trading inside a range, or is it holding outside one?
The July 2025 lesson returns to highs, lows, support, resistance and trend lines. This guide turns that discussion into a repeatable chart-reading exercise. The current Stoic Range Model gives those observations a consistent framework.
Mark the structure you can actually see
Choose one chart timeframe. Mark the high and low that bound the area you are studying. Keep those boundaries fixed while reviewing the next response. If you redraw them after every move, you cannot tell whether your original reading was useful.
Inside those boundaries, smaller swings may rise or fall. That movement does not automatically mean the parent range has broken. Write down both observations: where price sits within the larger range, and what the smaller swings are doing.
Support and resistance describe areas where price previously responded. They do not identify the people behind a trade or guarantee another response. Treat a marked level as a place to observe behavior.
Separate consolidation from expansion
Consolidation contains overlapping movement within boundaries. Expansion travels away from an area. The practical difficulty is deciding whether an apparent escape will hold.
The video discusses a close outside the range followed by a retest. In the current Range Model, the distinction is the response at the boundary: a sweep followed by a held retest back inside, or a break followed by a held retest outside. One close alone does not settle that question.
For a break above the range, watch whether the old high can hold as support. For a sweep above it, watch whether price returns inside and the boundary holds as resistance. If neither response becomes clear, your chart can remain unresolved.
Keep the target consistent with the environment
For a sweep-and-retest setup inside the range, the midpoint and opposite boundary provide reference objectives. For a break-and-retest setup outside, project one and two range heights in the direction of the break.
Those measurements are a map for planning. They do not establish a hit rate. Intervening structure and the distance to invalidation may leave too little room for the trade you are considering. The profit-target guide explains how to make that comparison before entering.
Trend lines can help describe a move, but avoid adding a new line solely because the previous one failed. The definition should remain stable enough for another person to reproduce it from the same chart.
Practice without seeing the outcome
Open a historical chart and hide the candles to the right. Save a screenshot with the range boundaries, current price and your two possible responses. Record what would invalidate each response before revealing more candles.
Advance through the chart. Did price hold inside, hold outside, or stay unclear? Record losing examples and ambiguous examples alongside clean ones. Then repeat on another date using the same marking rules.
This exercise tests whether you can apply the definitions consistently. Demonstrating a profitable strategy requires a separate review of enough trades, execution costs and losses. Attractive chart examples alone cannot answer that question.
What to study next
Watch the technical analysis lesson for the original chart discussion. Then work through the break-and-retest guide with one chart and one timeframe. Keep your observations simple enough to review after the result is known.
Stoic Edge provides education. Historical examples and practice exercises do not establish future performance.
Watch the source videos
Study the original demonstrations alongside this guide. Recording dates and historical context appear on each video page.
Put the Lesson Into Practice
Study the course, keep notes and review trades in Stoic Journal beta, and learn alongside the Stoic Traders community.
Compare monthly and yearly course access before joining on Skool. Compass is included while monthly membership is active; yearly Premium includes lifetime course and Compass access. You can also get Stoic Edge Compass separately.
