Range Trading Profit Targets: Midpoint, Boundary and Expansion
Use the range midpoint and opposite boundary after a sweep, and measured range heights after a breakout. Includes a historical Nasdaq chart example.
4 min read
Range trading profit targets depend on what price does at the boundary. In the Stoic Range Model, a sweep and held retest back inside the range points attention toward the midpoint, then the opposite boundary. One breakout that holds its retest outside the range uses one and two range heights as projected objectives.
Those levels give you places to make decisions. Price can turn before reaching them, and reaching a level does not tell you what happens next.
Mark the range before measuring a target
Identify the range high and low from the consolidation you are studying. The midpoint sits halfway between them. Keep that parent range visible when you move to a smaller chart for an entry.
For illustration, a range from 100 to 110 has a midpoint of 105 and a height of 10. This arithmetic example is separate from the historical chart below.
Changing the box after every price move can make almost any target appear correct in hindsight. Keep a record of the range you used when making the decision.
Targets after a sweep and retest
When price sweeps below the low, returns inside, and holds a retest, the midpoint is the first reference objective. The range high is the next one if the move continues. One sweep above the high gives the reverse map: midpoint first, then range low.
In the illustrative 100–110 range, a bullish reclaim near 100 would put 105 and 110 on the map. Whether either objective offers enough room depends on your actual entry and stop.
You do not have to hold every position for the opposite boundary. Decide how you will handle the midpoint before entering, then watch whether the trade continues to behave as expected.
Targets after a break and held retest
For a sustained break above the range high, project the range height upward from that boundary. In the same arithmetic example, a height of 10 gives objectives of 120 and 130 above the 110 high. Below the 100 low, the corresponding projections are 90 and 80.
These projections describe distance. They do not assign a probability of reaching it. If price fails to hold outside the boundary, the expansion premise may no longer apply.
The break-and-retest guide explains how a smaller entry pattern fits into that larger map.
Nasdaq example: the target arrived early in the week
The September 27 episode reviews Nasdaq moving from the midpoint toward the range high on September 21.
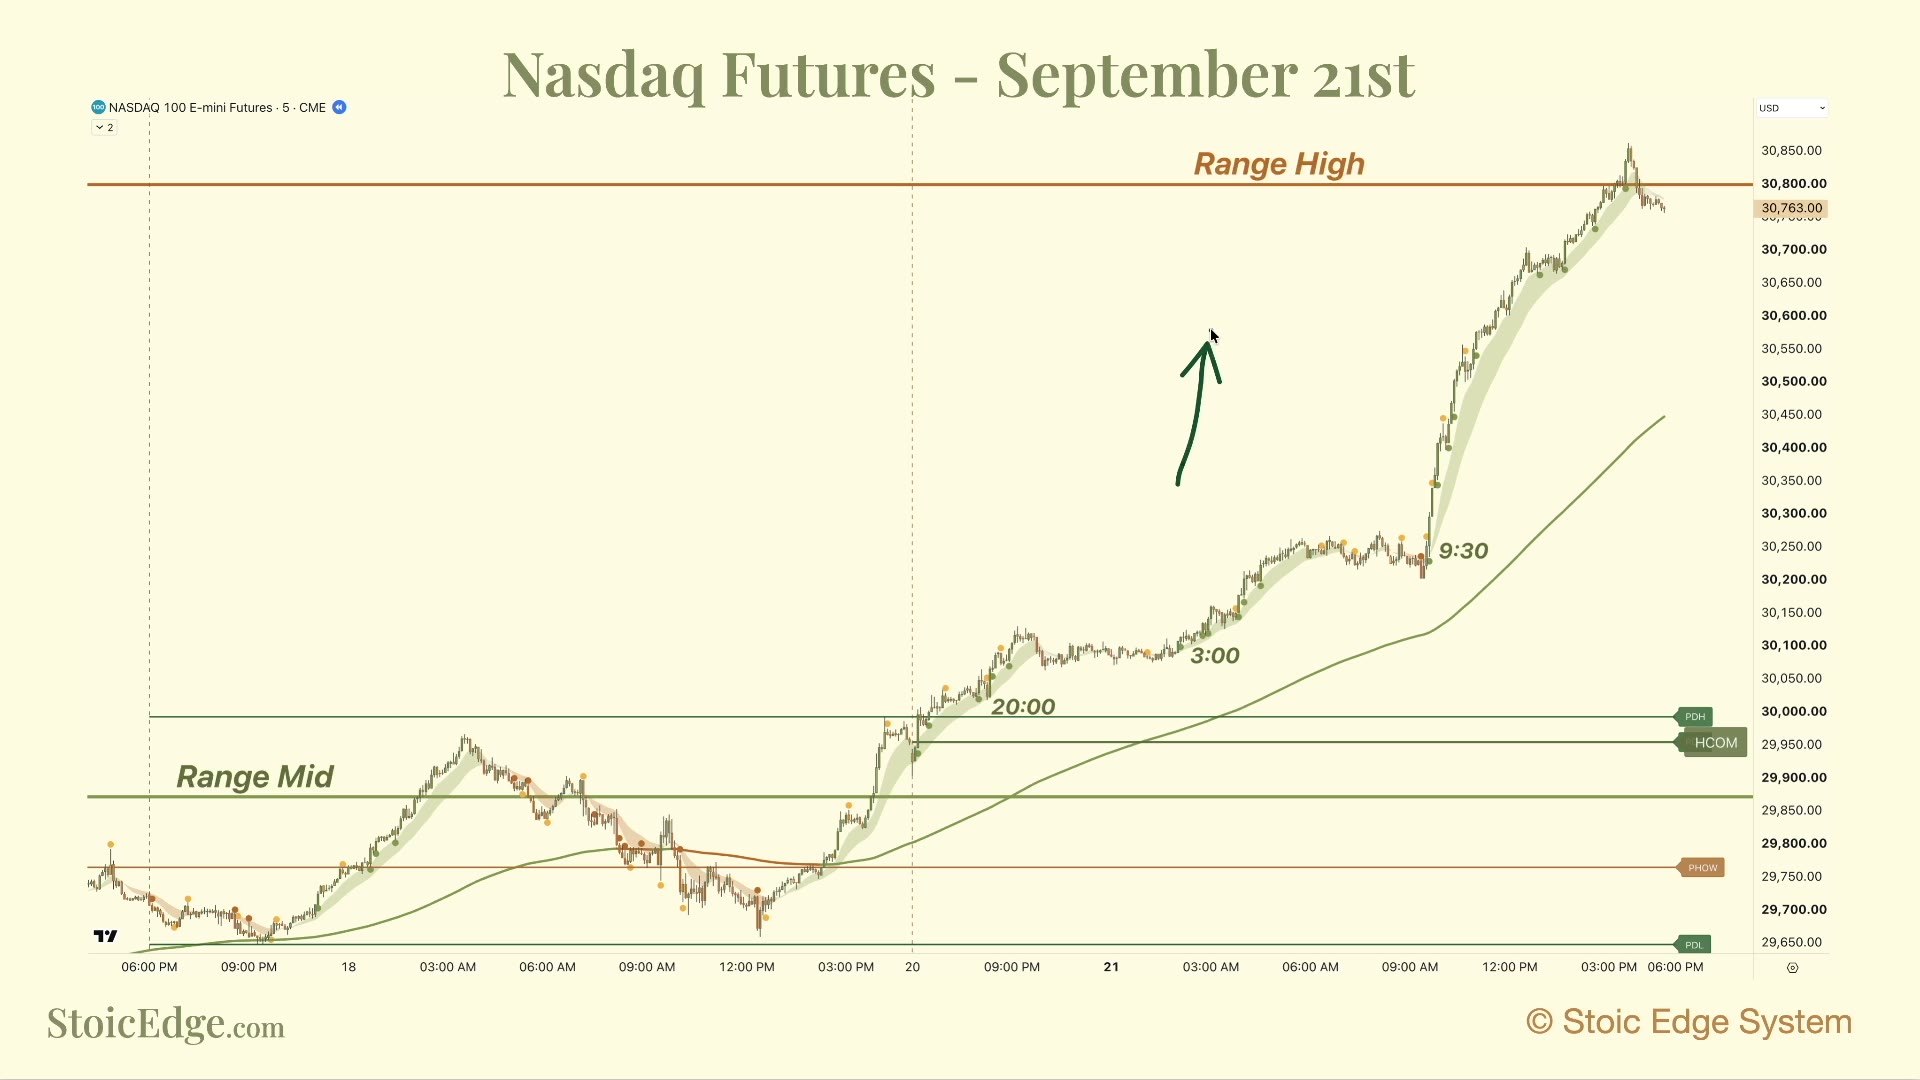
Around 2:11, the recording turns to the smaller chart. It follows the advance through the session and the local entry opportunities along the way. Around 5:32, the discussion returns to the range-high objective.
The useful decision is what to do once price has covered the distance you planned to trade. The episode notes the possibility of a reaction at the high. Another candle in the same direction would not, by itself, create a fresh trade.
This is a retrospective teaching example, not a record of an executed position or its return.
What if price turns before the target?
Review the trade against its original conditions. If the reason for holding has failed, an untouched target does not restore it. If the setup remains valid, manage it according to the plan you chose.
Before entry, record your first objective, what would invalidate the trade, and how you will respond if momentum stalls. This makes a later exit easier to assess without pretending you can know the exact turning point.
The guide to stopping overtrading covers the next decision: whether there is any reason to keep trading after the planned move.
Watch the example
Watch the complete episode, or go to the Nasdaq review at 2:11 on YouTube.
Use the full Range Model guide to connect these objectives to the two boundary responses. Test the rules you intend to use; one historical chart cannot show how a method performs across different conditions.
Stoic Edge provides education. Historical examples and practice exercises do not establish future performance.
Watch the source videos
Study the original demonstrations alongside this guide. Recording dates and historical context appear on each video page.
Put the Lesson Into Practice
Study the course, keep notes and review trades in Stoic Journal beta, and learn alongside the Stoic Traders community.
Compare monthly and yearly course access before joining on Skool. Compass is included while monthly membership is active; yearly Premium includes lifetime course and Compass access. You can also get Stoic Edge Compass separately.
