Start here
Make sense of the chart before choosing a trade
Know where your attention belongs and what response you are waiting for. Start with the Stoic Range Model: one range, two setups and two targets to study before choosing an entry.
The article and video are free.
Watch the Range Model lesson
Mark the range first
Price consolidates, expands, then consolidates again. Choose the chart that owns your idea and mark a range you can explain before the next move. Keep its high, low and midpoint fixed for the decision you are studying. If the evidence changes, record why you changed the box.
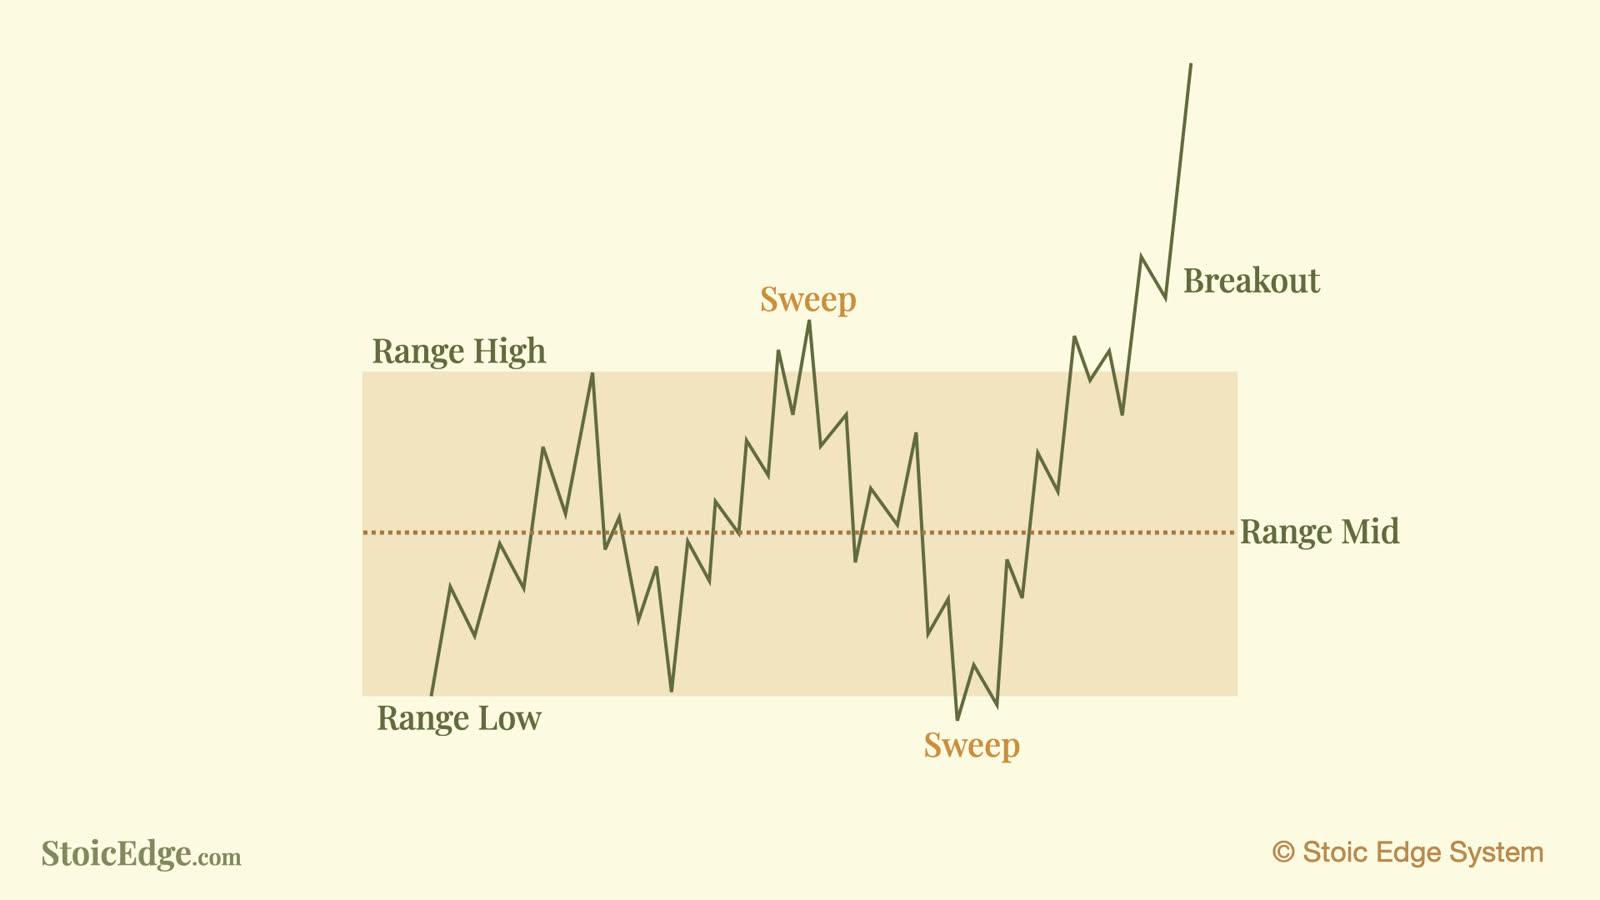
Two responses to study
These targets are measuring objectives. Price can turn before reaching them. Touching or closing beyond a line does not complete a retest. Define invalidation, size and management before entry, and wait when the response is incomplete.
How the system fits together
The Range Model gives location. The 1-2-3 sequence and PTB help you read price action, including continuation, failure and reversal. Fib geometry measures the selected structure for entry and management. The application determines the sequence; a Fib entry does not always wait for a later PTB. SBS and Golden SBS remain supporting methods with their own rules.
Compass adds chart context through its dots, caution states and ribbon. It leaves the entry, stop, size and exit to your plan. Signals in the middle of the parent range do not create a new boundary setup.
Put the lesson into a daily process
Start with one observation. Then choose the support that fits what you need to learn next.