Market Structure Trading: Swings, Context and Reversal Confirmation
Understand market structure through swing highs, swing lows and the move that broke a level. Separate the parent range from an internal reversal.
4 min read · Free guide · No signup required
Jump to a section
Your one-minute chart breaks a low while the hourly chart is still pulling back inside its range. Calling both charts bearish hides the decision you actually need to make: which swing matters to this trade?
This guide will help you separate the parent structure from the smaller entry sequence, then define what evidence would change each reading. Stoic Trader’s 2023 and 2025 lessons supply the chart examples; the current Range Model keeps the larger environment visible.
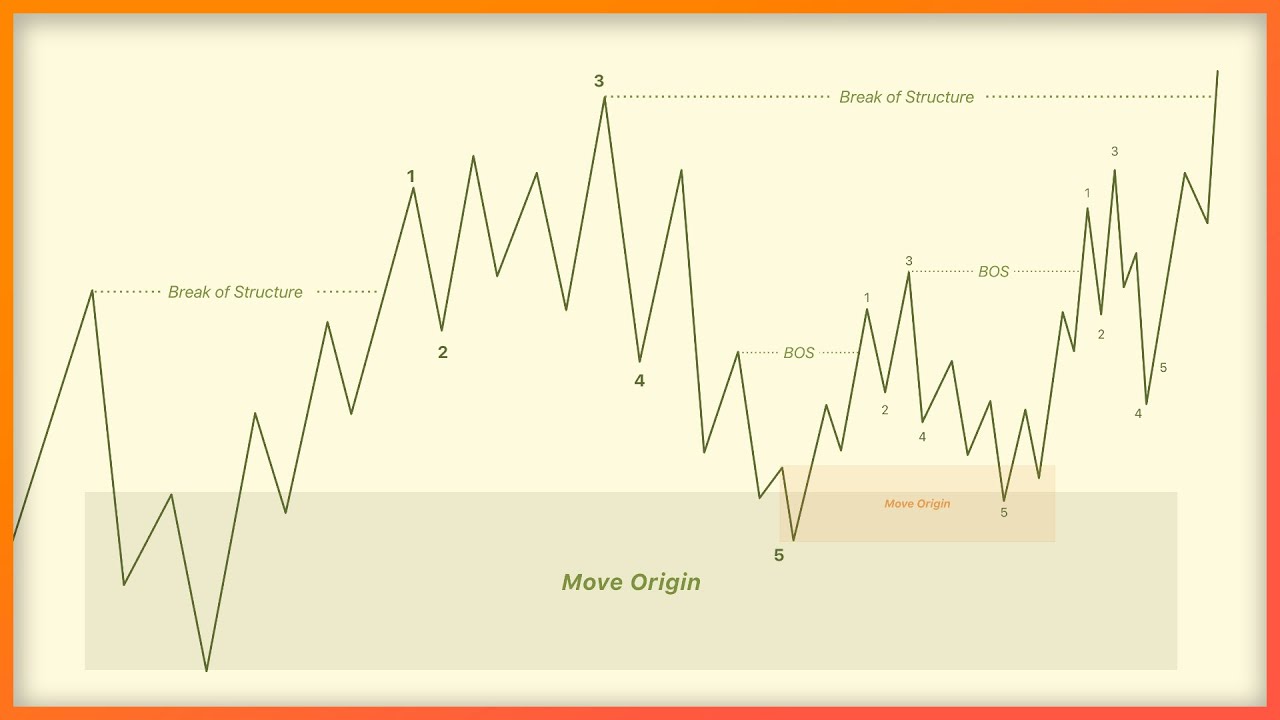
Use the same rule to mark every swing
On a bullish sequence, price makes a higher high after a pullback. The low associated with that move is a reference for the next structural decision. On a bearish sequence, reverse the relationship: lower lows and lower highs.
Choose your swing-marking convention before reviewing examples. Decide which timeframe defines the context and what counts as a break. One wick through a level and a sustained move beyond it are different observations. If your rule changes after the outcome, the labels stop being useful evidence.
The videos use terms such as “protected low” and “move origin.” The protected low is the reference low associated with a subsequent break higher in that lesson’s structure model. The move origin is the area from which the relevant move began. Neither term means price must hold there.
Keep internal movement separate from the parent range
An hourly pullback can contain a complete bearish sequence on a one-minute chart. That smaller bearish sequence does not, by itself, prove the hourly structure has reversed.
Write the two readings separately. For example: price is pulling back within the parent range; the execution chart is making lower highs. Then define the event you need before considering a change on the execution chart.
The 2023 deep dive repeatedly distinguishes the larger swing from the intermediate movement inside it. This helps explain why buying every small break higher can lead to repeated entries in the middle of an unresolved pullback.
Let the smaller response confirm the planned area
The lessons look for a return toward the origin of a prior move, followed by a change in the smaller structure. The useful sequence is location, response, then entry permission.
For a bullish reversal example, price may sweep a low, recover, break a relevant smaller high and return to test the recovered structure. If the recovery fails, the bullish idea needs to be rejected according to the rule you set. The swing-failure guide explains the difference between a brief breach and a completed setup.
Avoid turning the phrase “trapped traders” into a fact about specific market participants. One chart shows price and the data supplied by that market. It does not reveal every trader’s position, motive or stop order.
Define risk before selecting a target
Mark the condition that invalidates the setup before calculating position size. Then compare the entry-to-stop distance with the available room to the next objective. Nearby opposing structure may make an otherwise recognizable pattern unattractive.
For the current Range Model, use midpoint and opposite-boundary objectives for a sweep and held retest inside the range. For a break and held retest outside, use one and two range heights as reference projections. The older structure lessons may use prior swing extremes; keep the version you are testing explicit.
Write two readings of the same chart
On one saved example, finish these sentences: “On my context timeframe, price is…” and “On my execution timeframe, price is…”. Name the range or swing in each sentence. Then mark the event that would make each description wrong.
If both sentences refer to the same small fluctuation, zoom out and identify the parent structure again. If they describe different directions, keep the disagreement visible until your entry rules resolve it. You have a useful map when you can explain which observation governs the next decision.
If you want a consistent directional display beside that work, the Compass guide explains its closed-bar states and the decisions it leaves to you.
Freeze the chart before deciding what changed
Freeze a chart before the response, mark the parent range and internal swings, and write one conditional decision. Reveal the next candles and keep the original marks. Save the failed and unclear examples too.
Use the 2023 foundations lesson, market-structure deep dive and 2025 market-structure course to compare the language across recordings. They share a concern with location and confirmation, but their historical entry details should not be combined into an unwritten new system.
Stoic Edge provides education. Historical examples and practice exercises do not establish future performance.
Watch the source videos
Study the original demonstrations alongside this guide. Recording dates and historical context appear on each video page.
Keep learning for free
