How to Use Stoic Edge Compass in a Trading Plan
Understand the Compass color states, wait for the bar to close, and keep entry, invalidation and position size in your own trading plan.
4 min read · Free guide · No signup required
Jump to a section
The candle changes color while it is still forming. It is tempting to treat the new state as permission to enter, before you have checked the location or decided where the trade would fail.
Stoic Edge Compass organizes its chart reading into green, red and yellow states. This guide shows you when to read that state and how to fit it into an entry and management plan. You will also build a short record that separates the indicator reading from the decision you made.
The September 2026 demonstration uses historical and then-current charts. Features and settings can change after a recording, so use the current Compass page and in-product documentation for current access and configuration.
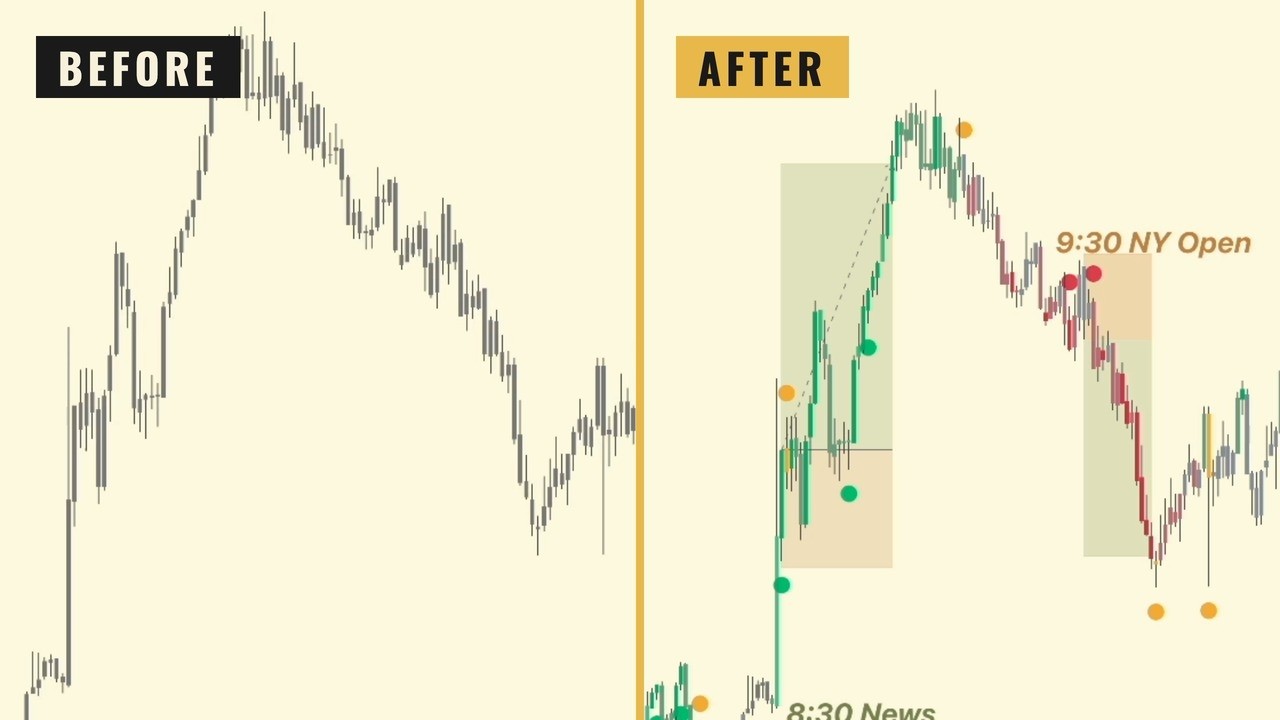
Read the state after the bar closes
The current product guidance is to read green, red or yellow after the bar closes. Green presents the bullish reading, red the bearish reading and yellow calls for caution as momentum or conditions change.
Use the current Trend Ribbon and directional dots for chart context. You mark the Range Model high, low and midpoint yourself. Compass also displays Dynamic Support/Resistance zones; those zones are separate context and do not choose your range boundaries or qualify an entry. One color state does not specify how much you should risk or guarantee that the next move continues in that direction.
Do not treat every intrabar change as a completed signal. In your records, distinguish what was visible during the bar from the state you evaluated after its close.
Read the color beside the range location
Mark the parent range before selecting an entry. Is price responding at a boundary, trading in the middle, or holding outside after a break? That location affects the setup you are evaluating.
The Stoic Range Model provides the foundation. One sweep and held retest inside the range has different reference objectives from a break and held retest outside it. Compass can support the directional reading; it does not remove that distinction.
If the state and your planned setup conflict, use the rule you defined for that situation. Do not switch between following the indicator and ignoring it according to which choice supports the trade you want.
Write the entry condition before acting on a color
The demo mentions SBS as an example of an entry application. You can study that application through the SBS guide, but it is not a universal prerequisite for using Compass.
Choose an entry method and define the event that permits an order. Then identify invalidation, calculate size and check the room to the objective. These decisions remain necessary even when the chart state looks clear.
The recording includes an experimental SBS feature as it existed at the time. Do not assume a feature shown in an older demonstration is enabled in your current settings. Check the version and settings you are actually using.
Choose your yellow-state response before the trade
The video discusses yellow as a reason to reassess continuation and management. That does not mean every yellow state requires the same exit.
Write the management rule before the trade. Does the state prompt a review at the close, a particular stop adjustment, or no change unless price also meets another condition? Each version is a different rule and needs its own record.
If you change the rule during an open position, note the deviation. Otherwise the journal will make a discretionary decision look like part of the original plan.
Separate what Compass showed from what you decided
On a historical example with your current settings, pause after a bar closes. Record the color state, the parent-range location and your entry condition in separate fields. Check whether the condition is present before looking at the next bar.
Repeat at the first yellow state. Compare the action your written management rule calls for with the action you feel like taking. Keep both in the note if they differ. That gives you something specific to review even when the eventual trade result looks good.
Review the tool through actual decisions
Save the indicator settings, chart timeframe, closed-bar state, parent range and entry rule for each example. Include losing trades, unclear states and sessions where no setup appeared.
Judge whether the tool helped you apply the same process consistently. Profitability requires separate evidence after realistic execution costs. Watch the Compass demonstration with the current product information open when comparing the recorded interface with your own chart.
Stoic Edge provides education. Historical examples and practice exercises do not establish future performance.
Watch the source videos
Study the original demonstrations alongside this guide. Recording dates and historical context appear on each video page.
Keep learning for free
